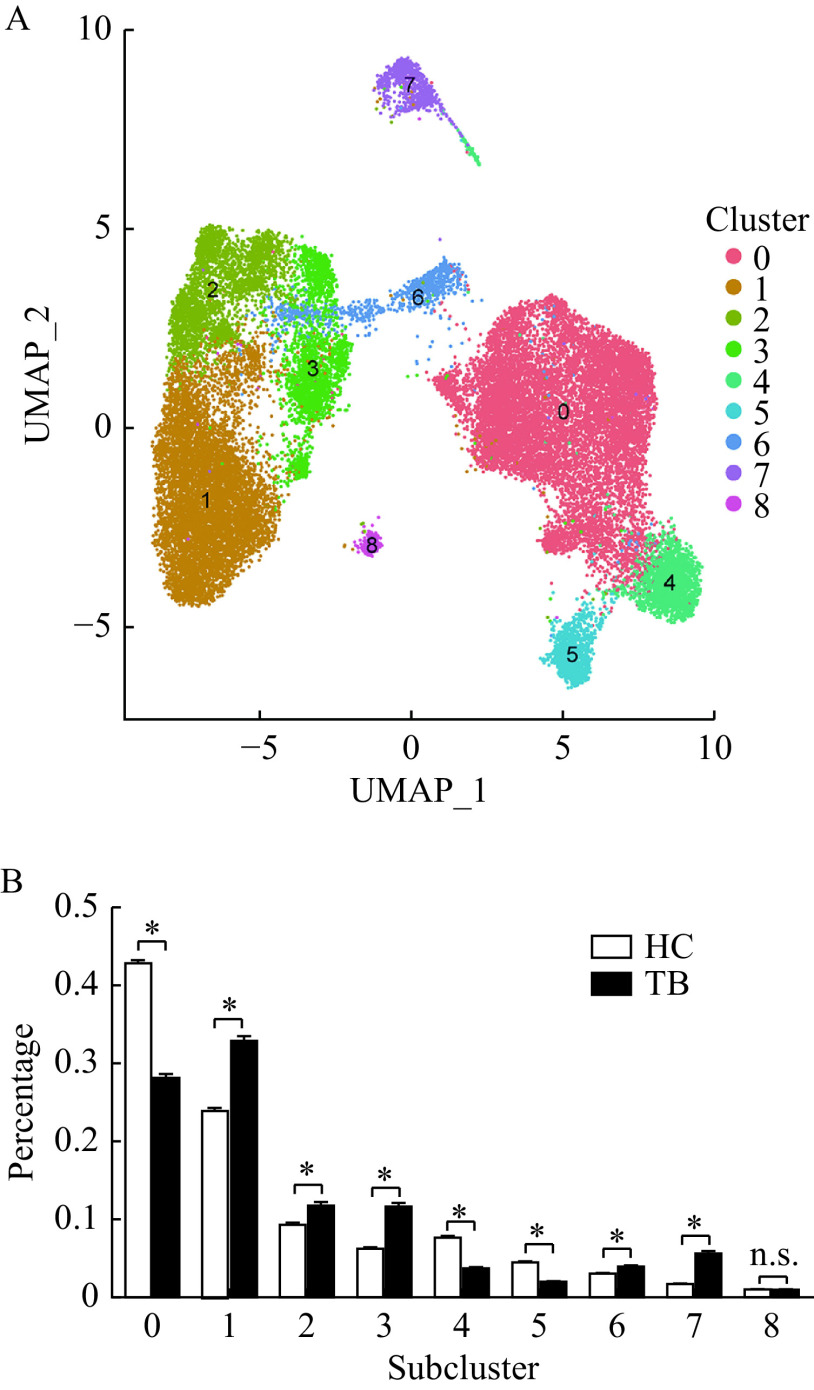
Figure 3.
Different subclusters of alveolar macrophages identified in BALF cells.
A: UMAP plot of 9 identified macrophage subclusters based on scRNA-seq by Seurat R package. Different colors specify assignment of 9 subclusters by nearest neighbor clustering. B: Comparisons of the proportions of cells from different alveolar macrophage subclusters in healthy controls and tuberculosis patients by Student's t-test. The data were shown as mean±SEM. n.s.: no significance; *P-value<0.05. UMAP: Uniform Manifold Approximation and Projection; BALF: bronchioalveolar lavage fluid; HC: healthy controls; TB: tuberculosis patients.

