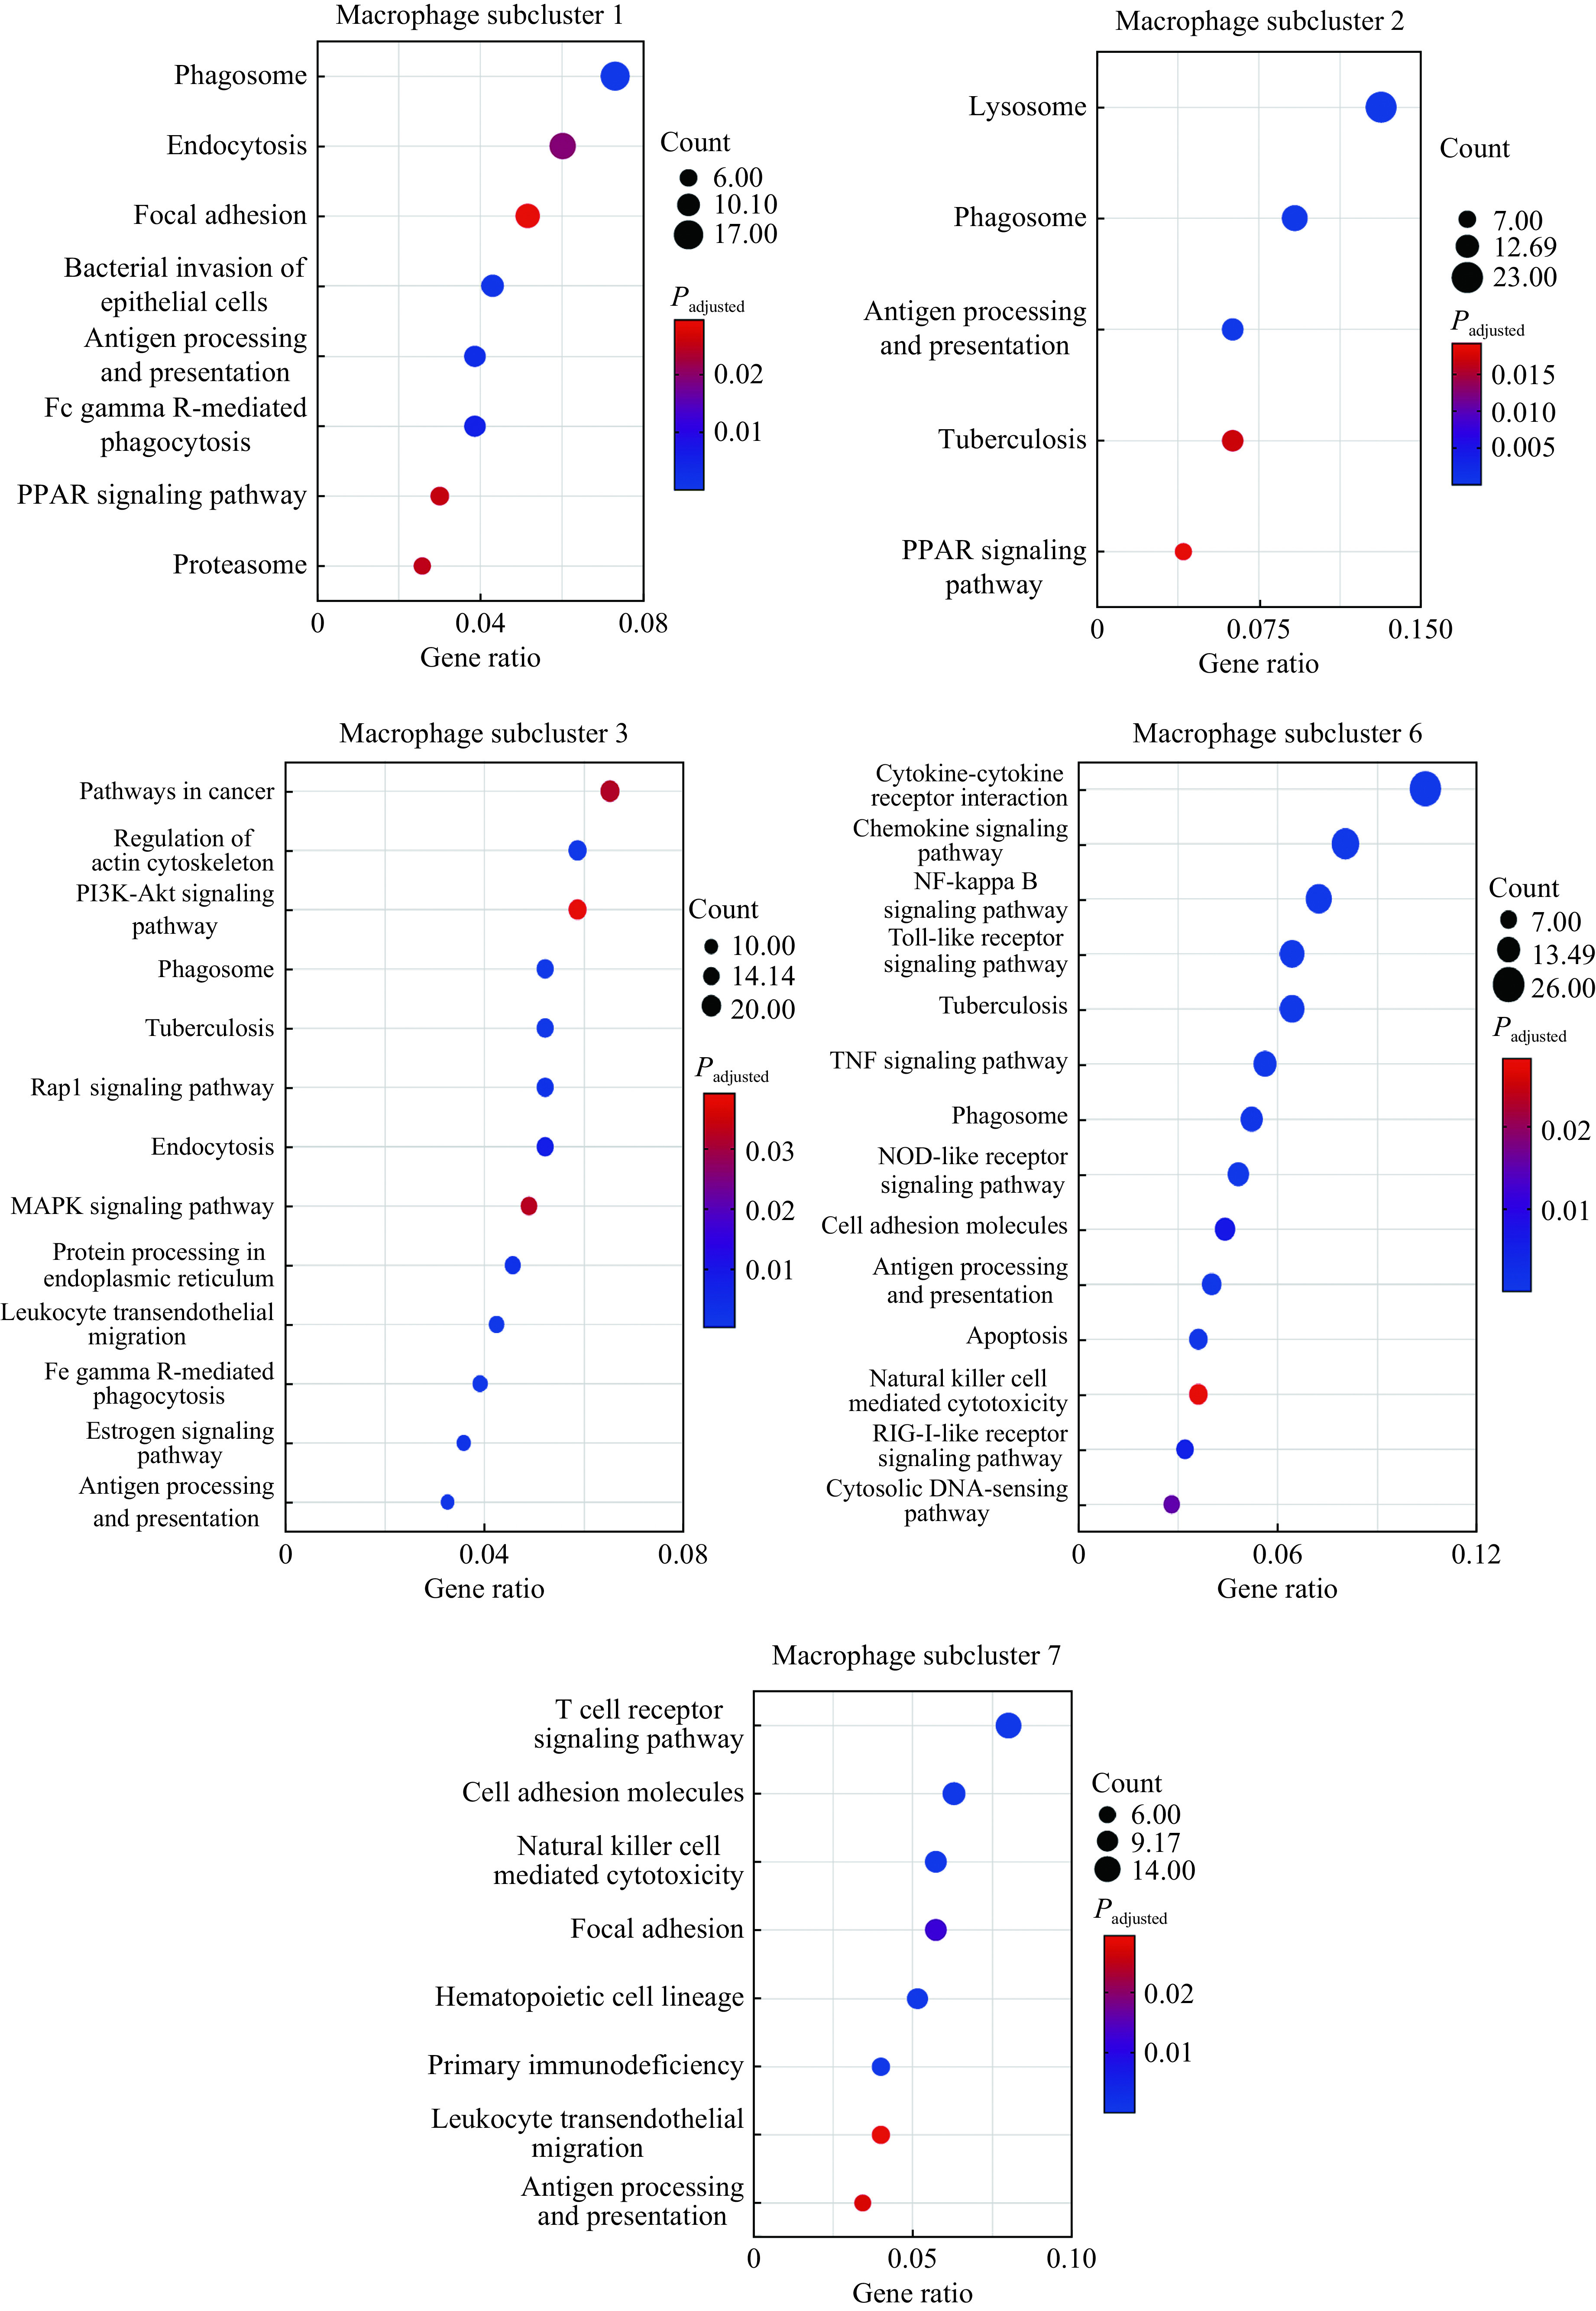
Figure 5.

Functional enrichment analysis of macrophage subclusters that increased in active tuberculosis patients (subclusters 1–3, 6, and 7) with the upregulated differentially expressed genes.
The X-axis of the dot plot represents gene ratio and the Y-axis represents the significantly enriched pathways (adjusted P-value<0.05). The dot size represents the count of pathways enriched in each subcluster. The color intensity refers to the adjustedP-value.
