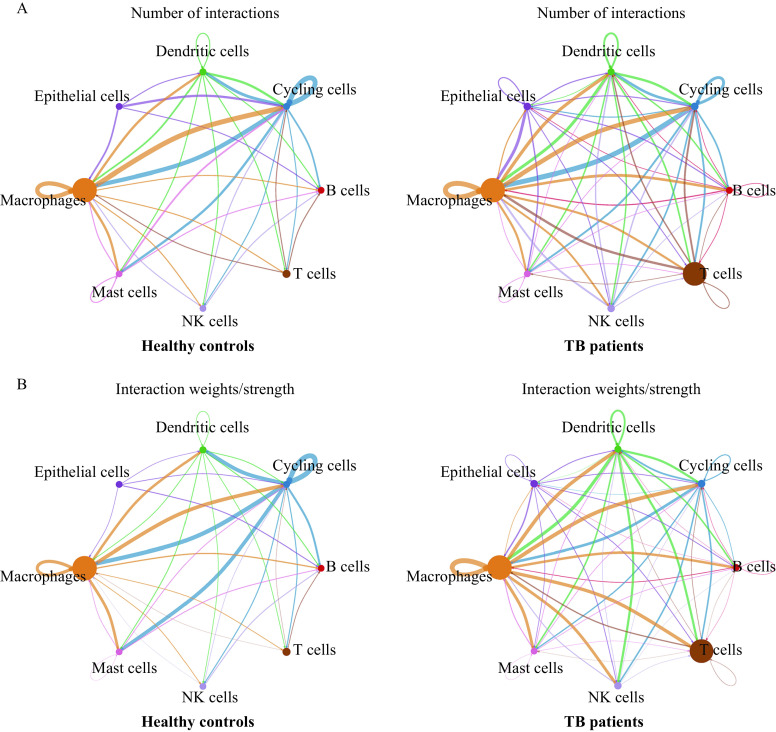
Figure 9.
Intercellular communications between macrophages and other cell types in tuberculosis patients and healthy controls.
A: Number of interactions between macrophages and other cell types in TB patients and healthy controls. The edge width represents the number of interactions. B: Interaction weights between macrophages and other cell types in TB patients and healthy controls. The edge width represents the strength of interactions. Circle size represents the number of cells in each cell type. TB: tuberculosis.

