
FIGURE 6.
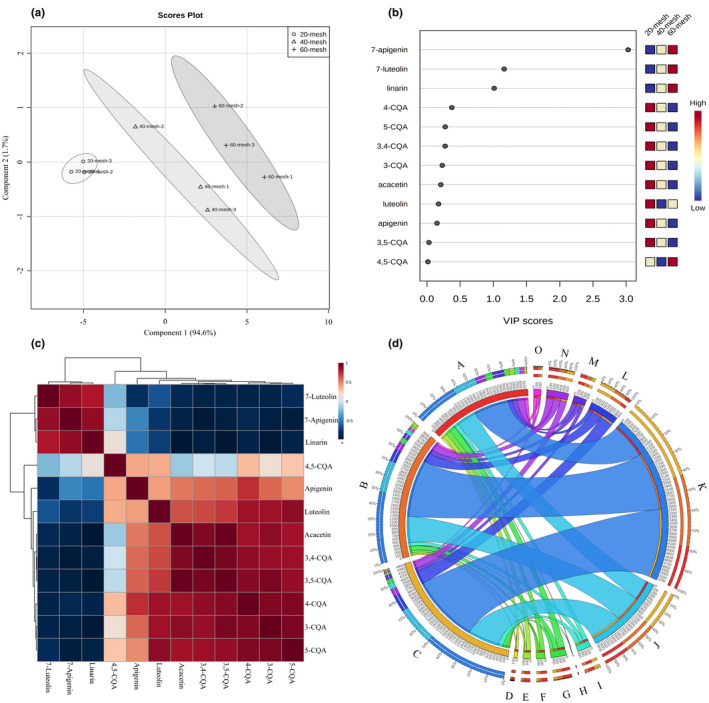
Multivariate statistical analysis of phenolic compounds from various samples. (a) Score plot of the principal component analysis (PCA). (b) Variable importance on projection (VIP) plot of partial least squares regression discriminant analysis (PLS‐DA). (c) Correlation heatmap analysis. (d) Circosplot shows an intuitive result of the correlation coefficients between the samples and various phenolic compounds. (A: 20‐mesh; B: 40‐mesh; C: 60‐mesh; D: 3‐CQA; E:4‐CQA; F: 5‐CQA; G: 3,4‐CQA; H: 3,5‐CQA; I: 4,5‐CQA; J: luteolin‐7‐O‐glucoside; K: apigenin‐7‐O‐glucoside; L: linarin; M: luteolin; N: apigenin; O: acacetin)