FIGURE 3.

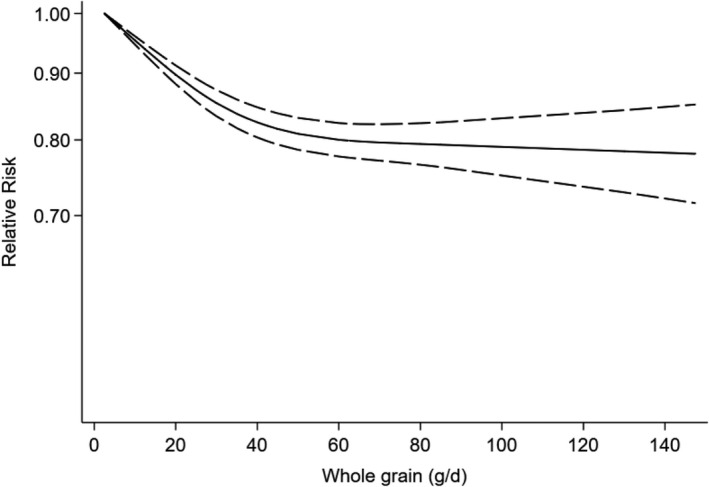
Dose–response analysis of risk of type 2 diabetes and whole grain consumption. The solid line and the long‐dashed line represent the estimated HR and its 95%CI; the solid line represents the linear relation

Dose–response analysis of risk of type 2 diabetes and whole grain consumption. The solid line and the long‐dashed line represent the estimated HR and its 95%CI; the solid line represents the linear relation