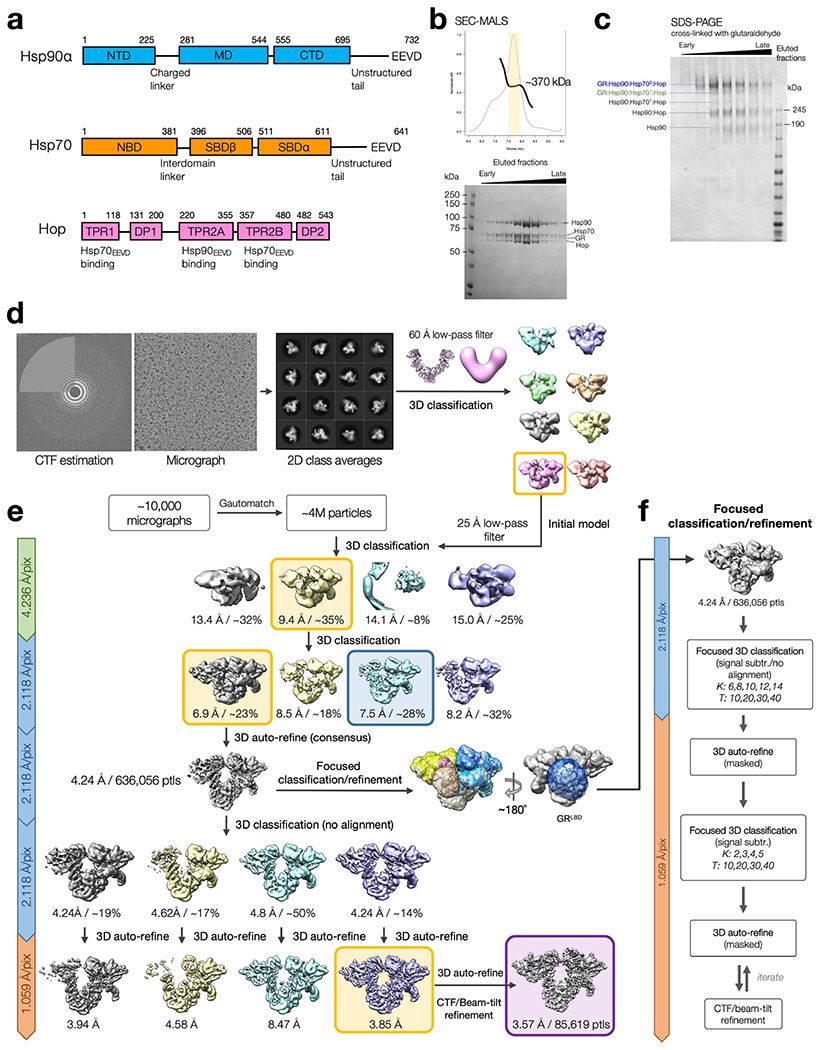
Extended Data Fig. 1 |. Purification of the GR-loading complex and the cryo-EM single-particle image processing pipeline.

a, Domain organization of the chaperone proteins in the GR-loading complex. b, Top, elution profile of gel filtration using SEC-MALS to confirm the homogeneity of the GR-loading complex. The apparent molecular weight of the eluent estimated by SEC-MALS is ~370 kDa, although the two-Hsp70 client-loading complex is ~440 kDa. The discrepancy may be a result of multiple species co-eluted. Bottom, SDS–PAGE stained with Coomassie blue of the eluted fractions marked in (top). c, SDS–PAGE stained with Coomassie blue of the fractions treated with 0.02% (w/v) glutaraldehyde cross-linking for 20 min at room temperature, followed by quenching with 20 mM Tris buffer at pH 7.5. Data in (b-c) are representative data of at least two independent experiments. d, Initial model generation for the GR-loading complex. The 60 Å low-pass filtered initial model used to reconstruct the 3D model was adopted from the Hsp90 semi-open conformation structure from the Hsp90:Hop cryo-EM structure34. e, Schematic workflow of the global cryo-EM map reconstruction. Yellow boxes indicate the selected class to move forward. Blue box indicates one-Hsp70 loading complex. Purple box indicates the final high-resolution global reconstruction. f, Flow chart of focused classification/refinement using the signal subtraction approach from RELION. Final reconstructions for individual masked classifications/refinements were selected based on the resolution intercepted with the FSC 0.143 from 3D auto-refine. K=number of classes; T=regularization factor, Tau.
