
Extended Data Fig. 4 |. Interfaces I and II are both crucial for Hsp90–Hsp70 interactions and client activation.
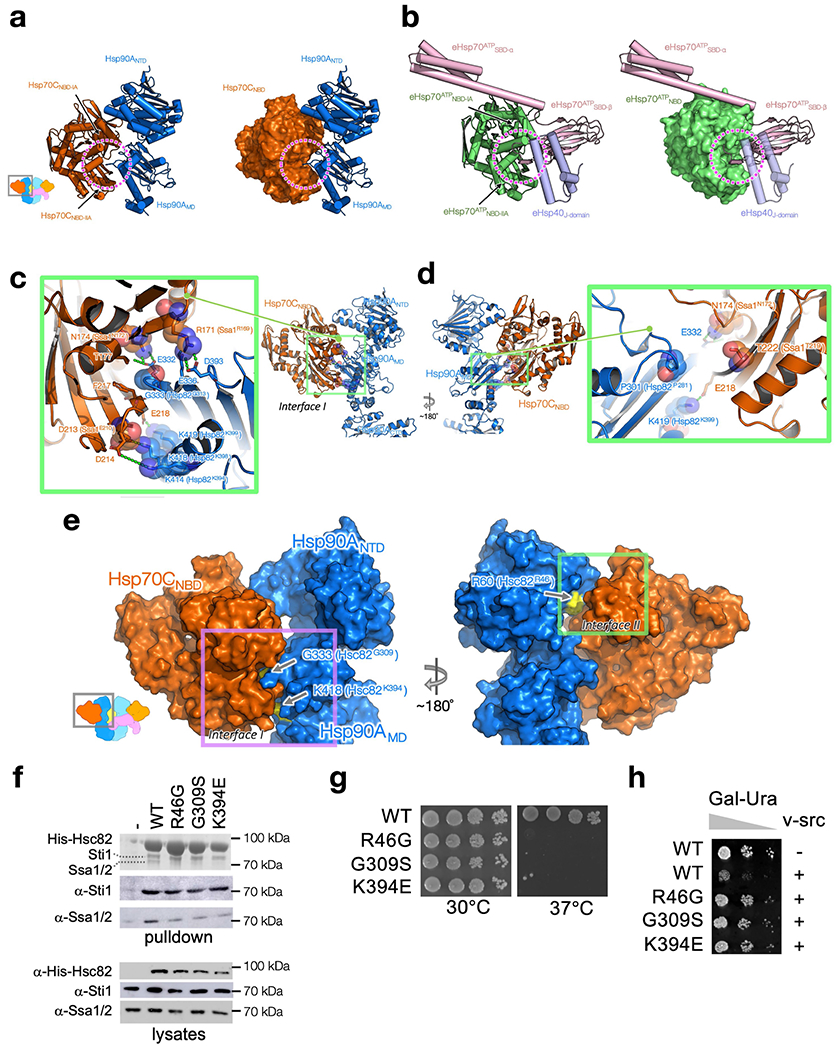
a, b, The Hsp70 cleft (dashed circles), formed by Hsp70NBD-IA and Hsp70NBD-IIA (a), which Hsp90MD interacts with, is used by the Hsp70 interdomain linker in the Hsp70 ATP state and Hsp40’s J-domain (b). Hsp90A:Hsp70C in the loading complex are shown as cartoon (a, left) and surface (a, right) representation. The E. coli Hsp70 (eHsp70):J-protein complex in the ATP state (PDB ID: 5NRO73) are shown as cartoon (b, left) and surface (b, right) representation. The two subdomains of eHsp70 are coloured in green for eHsp70ATPNBD and in pink for eHsp70ATPSBD. The E.coliHsp40J-domain (eHsp40J-domain) is coloured in purple. c, d, Mapping Hsp90/Hsp70 residues previously characterized by the Wickner group on the loading complex. Five yeast Hsp90 (Hsp82P281,G313,K394,K398,K399)23 and four yeast Hsp70 (ssa1R169,N172,E210,T219)24 mutations previously characterized by the Wickner group23,24 are all located at Interface I. These ‘Wickner residues’ are shown with stick and transparent sphere representation, whereas residues that interact with the Wickner residues are shown with only stick representation. Polar interactions are highlighted with green dashed lines. Residue numbers of the Wickner residues in yeast Hsp90/Hsp70 are shown as the labels within parentheses. Based on the proximity of the Wickner residue positions to Interface I residues, our structure can readily explain why Hsp82P281C (P301, Hsp90) and Ssa1T219C(T222, Hsp70) (d) showed no effect, whereas the other four Hsp90 mutants (Hsp82G313S(G333, Hsp90), Hsp82K394C(K414,Hsp90), Hsp82K398E(K418,Hsp90), Hsp82K399C(K419, Hsp90)) and the other three Hsp70 mutants (Ssa1N172D(N174, Hsp70), Ssa1R169H(R171, Hsp70), Ssa1E210R(D213, Hsp70)) (c) disrupted Hsp90:Hsp70 interaction significantly. e–h, In vivo validation of Interface I and II of the Hsp90:Hsp70 interactions in the GR-loading complex. Mapping the positions of the three mutations (arrows and yellow surface representation in e) used for in vivo validation on the atomic structure of Hsp90:Hsp70 (dark blue:dark orange; surface representation in e) in the GR-loading complex. The Interface I residues used, Hsp90G333 (Hsc82G309) and Hsp90K418 (Hsc82K394), are indicated by arrows (e, left panel). The Interface II residue, Hsp90R60 (Hsc82R46), is indicated by an arrow (e, right panel). Residue numbers of the residues in yeast Hsc82 are shown as the labels within parentheses in e. In f, His-Hsc82 complexes were isolated from yeast and analysed by SDS-PAGE and visualized by Coomassie staining and immunoblot analysis (see also Supplementary Fig. 10 for the uncropped gels/blots). Yeast proteins: Sti1=Hop; Ssa1/2=Hsp70; Hsc82=Hsp90β. In g, plasmids expressing wild-type or mutant Hsc82 were expressed as the sole Hsp90 in JJ816 (hsc82hsp82) cells. Growth was examined by spotting 10-fold serial dilutions of yeast cultures on rich media, followed by incubation for two days at 30 °C or 37°C. In h, strains expressing wild-type (WT) or mutant HSC82 were transformed with a multicopy plasmid expressing GAL1-v-src (pBv-src) or the control plasmid (pB656)74. Yeast cultures were grown overnight at 30 °C in raffinose-uracil drop-out medium until mid-log phase. Galactose (20%) was added to a final concentration of 2%. After six hours, cultures were serially diluted 10-fold onto uracil drop-out plates containing galactose. Plates were grown for 2-3 days at 30°C.