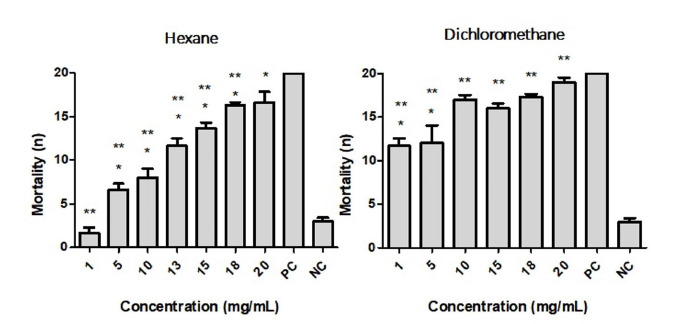
Figure 4. Dose-response curve of mortality (n) of Aedes aegypti pupae versus concentrations (mg/mL) of fractions of Helicteres velutina after 72 hours. The LC 50 and LC90 were calculated using non-linear regression, considering a 95% significance level. (*) Results significantly different from negative control. (**) Results significantly different from positive control.

