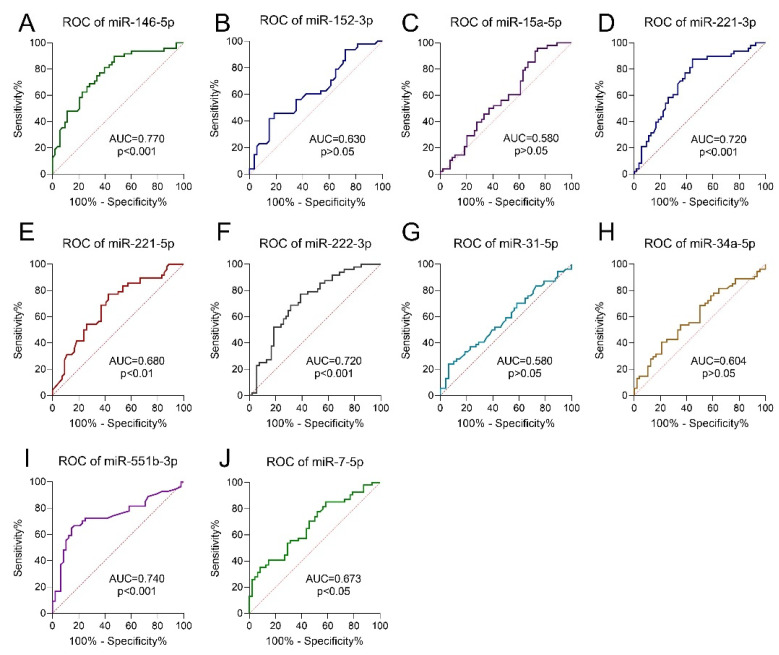
Figure 4.
ROC analysis was conducted to evaluate the diagnostic value of the DEMs as diagnostic biomarkers of PTC vs. control: (A) miR-146-5p; (B) miR-152-3p; (C) miR-15a-5p; (D) miR-221-3p; (E) miR-221-5p; (F) miR-222-3p; (G) miR-31-5p; (H) miR-34a-5p; (I) miR-551b-3p; (J) miR-7-5p. AUC values were calculated to estimate diagnostic performance of the DEMs in PTC. p-values indicate a significant difference from AUC = 0.5 (borderline of the diagnostic usefulness of the test).

