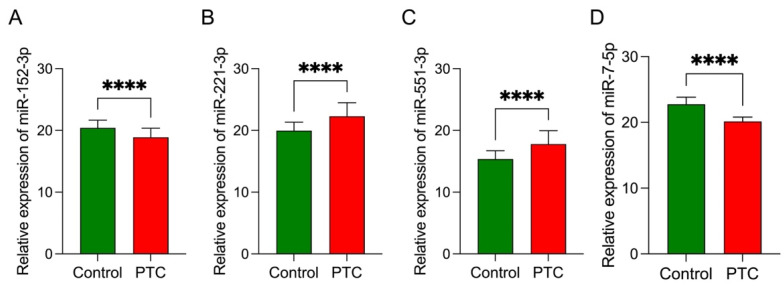
Figure 5.
Relative expression of DEMs included in the logistic regression model in control (N = 39) and PTC samples (N = 41): (A) miR-152-3p (Fold change (FC) = 0.37); (B) miR-221-3p (FC = 5.78); (C) miR-551b-3p (FC = 5.68); (D) miR-7-5p (FC = 0.18). Each bar represents the geometric mean ± standard error of mean of the ratio of miRNA expression and reference miRNAs (miR-103a-3p and U6 snRNA) calculated using the qBase MSExcel VBA based on multiple samples and multiple reference miRNAs. Asterisks indicate the levels of significance of differences (**** p< 0.0001); Mann–Whitney U-test was used to compare PTC and control samples. PTC, papillary thyroid cancer. FC values were provided using the GeneGlobe Data Analysis Center.

