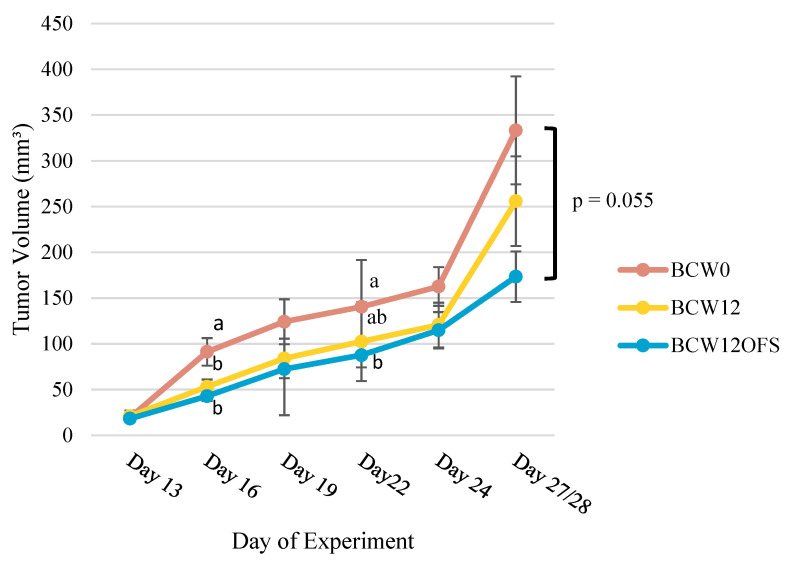
Figure 7.
Tumor volume over time. Average tumor volume at each measurement time point is plotted for each group. BCW0 (n = 10), BCW12 (n = 12), BCW12OFS (n = 12). Average volume differed significantly between groups on day 16 and day 22. Values without a common superscript are significantly different (p < 0.05; i.e., ‘a’ is different from ‘b’ but ‘ab’ is not different from ‘a’ or ‘b’). Data are presented as mean ± SEM.

