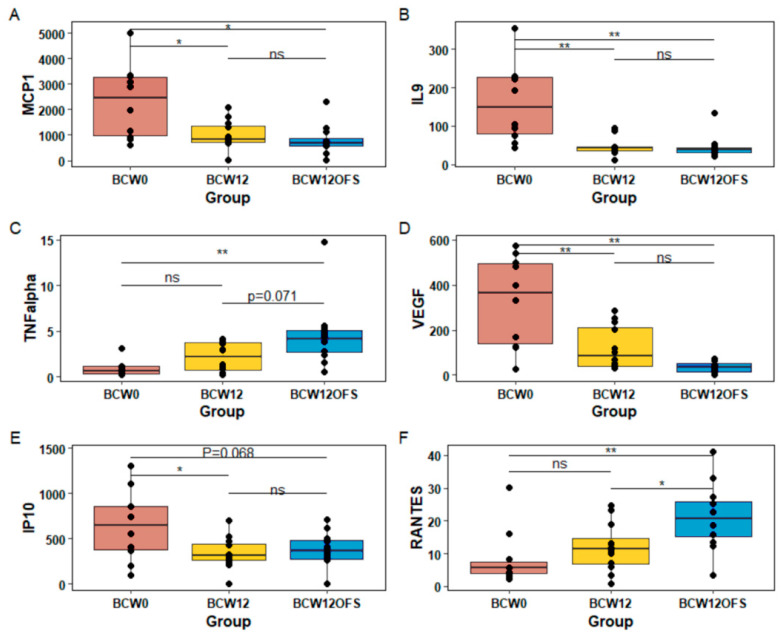
Figure 11.
Levels of key tumor cytokines. Tumor cytokine levels as measured by multiplex assay which differed significantly between groups are presented (A–F). These include levels of MCP-1 (A), IL-9 (B), TNFα (C), VEGF (D), IP-10 (E), and RANTES (F). * Indicates a significant difference of p < 0.05 and ** indicates a significant difference of p < 0.01. Data are presented as ± SEM and each point represents an individual mouse’s results. BCW0 (n = 10), BCW12 (n = 12), BCW12OFS (n = 12) for tumor cytokines and BCW0 (n = 9), BCW12 (n = 11), BCW12OFS (n = 12) for serum. ns: not significant.

