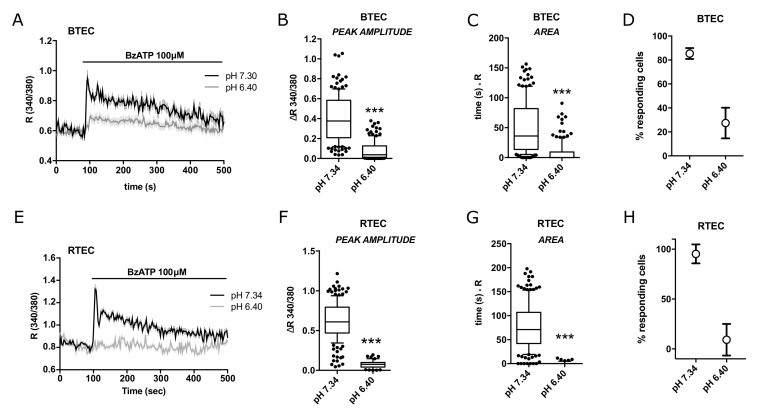
Figure 4.
BzATP-triggered cytosolic calcium signals in BTEC and RTEC are modulated by extracellular pH. (A) Representative traces of 100 µM BzATP-induced calcium signals in BTEC and (E) RTEC measured in physiological extracellular solution (pH 7.4; black traces) and their modulation by acidic conditions (pH 6.4; grey traces). (B,C,F,G) Peak amplitude and area of calcium signals measured in (A,E), respectively. Data are expressed as box and whiskers showing the median and 10–90 percentiles of at least 3 independent experiments for each condition (n ≥ 50). Kruskall–Wallis test: *** p-value < 0.0005. (D,H) Percentage of cells responsive to 100 µM BzATP out of total stimulated cells in A and E, respectively. Percentage was calculated on the total number of cells examined in a recording field. Data are expressed as mean value ± SEM of at least 3 independent experiments for each condition (n ≥ 3). Traces in (A,E) show the mean value ± SEM of all cells in the recorded field of one representative experiment. At least 3 independent experiments were carried out for each condition (n ≥ 3).

