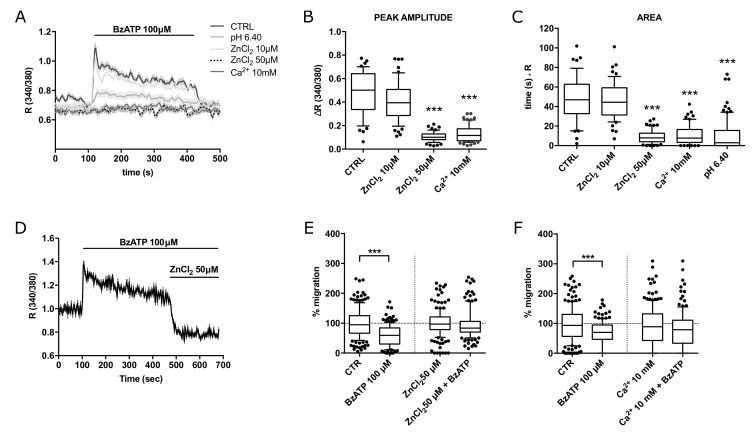
Figure 5.
BzATP-dependent calcium signals in BTEC are sensitive to extracellular zinc and high calcium. (A) Representative traces of 100 µM BzATP-induced calcium signals in high zinc (10 and 50 µM) or calcium (10 mM) extracellular solution. (B,C) Peak amplitude and area of calcium signals shown in (A). Data are expressed as box and whiskers showing the median and 10–90 percentiles of at least 3 independent experiments for each condition (n ≥ 50). Kruskall–Wallis test: *** p-value < 0.0005. (D) Representative traces of the acute inhibitory effect of 50 µM ZnCl2 on BzATP-induced calcium signals. (E) Percentage of BTEC migration in wound healing experiments at 8 h treatment with 100 µM BzATP, 50 µM ZnCl2 or BzATP and 50 µM ZnCl2 together. Data are expressed as box and whiskers showing the median and 10–90 percentiles of 3 independent experiments for each condition (n ≥ 140), each normalized to the corresponding control (CTR or 50 µM ZnCl2). Mann–Whitney test comparing BzATP treatment to the corresponding control. *** p-value < 0.0005. (F) Percentage of BTEC migration in wound healing experiments at 8 h treatment with 100 µM BzATP, 10 mM CaCl2 or BzATP and 10 mM CaCl2 together. Data are expressed as box and whiskers showing the median and 10–90 percentiles of 3 independent experiments for each condition (n ≥ 140), each normalized to the corresponding control (CTR or 10 mM CaCl2). Mann–Whitney test comparing BzATP treatment to the corresponding control. *** p-value < 0.0005.

