Figure 4.
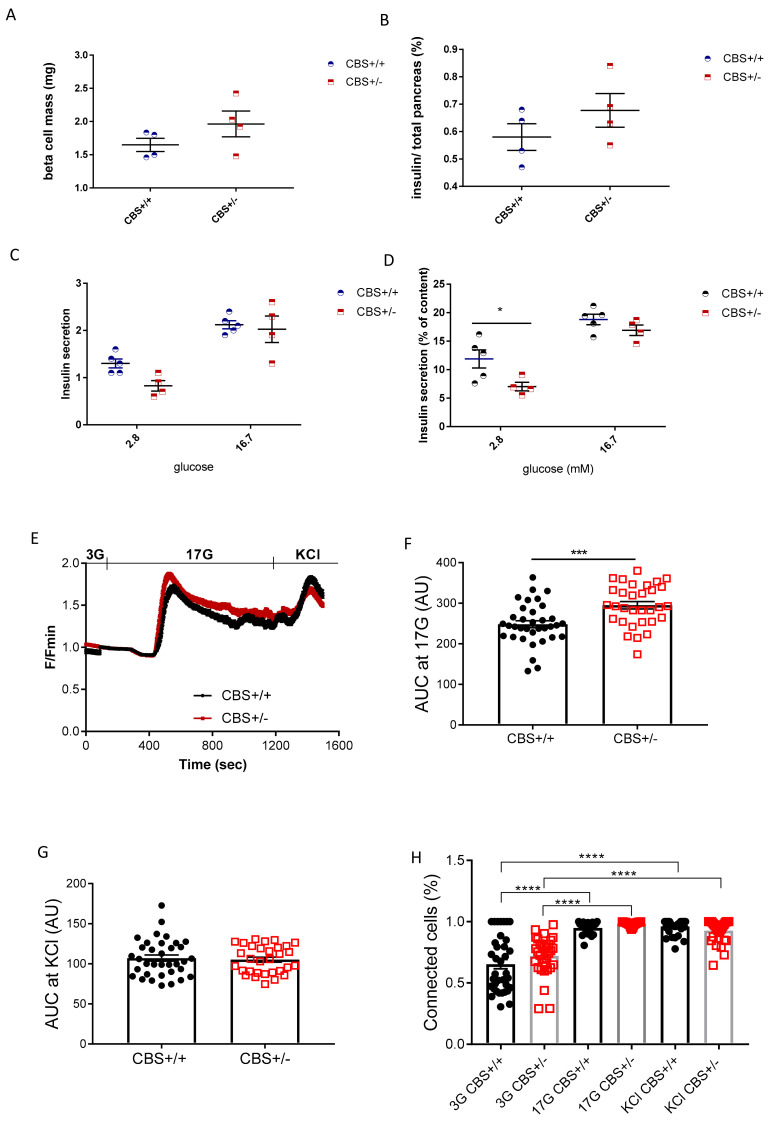
In vitro study in Met-HF mice. (A) Beta cell mass (mg). (B) Percentage of insulin reported to total pancreas. (C) In vitro insulin secretion of the isolated islets from the CBS+/+ and CBS+/− mice. (D) Normalization of insulin secretion by insulin content. (D) Intracellular Ca2+ responses from the CBS+/+ (n = 34) and CBS+/− (n = 31) islets isolated from the three mice per genotype in response to low (3 mm), high (17 mm) glucose, or 20 mm KCl. Both fluorescence amplitude.(* p < 0.05) (E) and (F) the area-under-the-curve of the glucose-evoked Ca2+ traces were increased in the CBS+/− islets (AUC; *** p < 0.001) under high glucose but not under the depolarizing stimulus with KCl (G). (H) The percentage of connected beta-cell pairs increased in both groups in response to 17 mm glucose or KCl (**** p < 0.0001). No differences were depicted between the mouse groups. Data are presented as Means ± SEM. Analysis by the unpaired t-test and two-way ANOVA with Tukey’s test.

