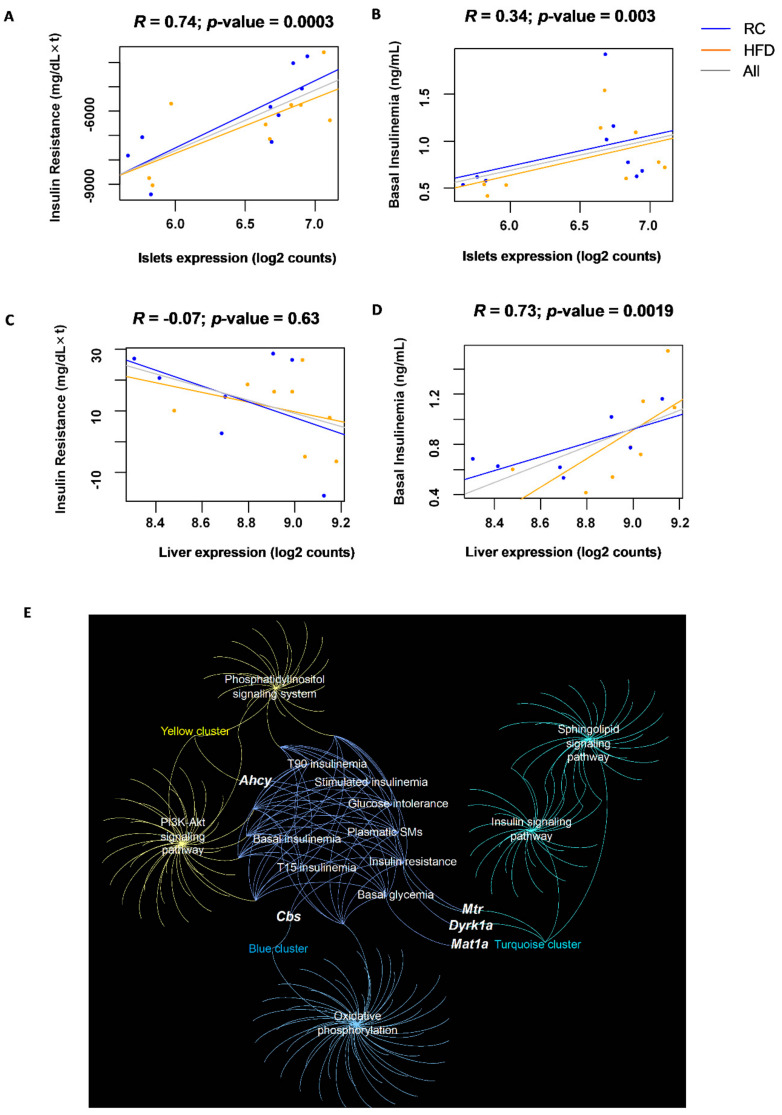
Figure 6.
The pancreatic islet correlations and liver correlations in the Rhapsody cohort of 3 strains of mice fed with RC or HFD. (A) Correlation of the CBS pancreatic islet expression and insulin resistance assessed by the AUC of ITT. (B) Correlation of the CBS pancreatic islet expression and basal insulin secretion. (C,D) Same correlations in the liver. (E) Network representing genes involved in homocysteine metabolism in the islets, their gene co-expression modules, the annotated KEGG pathways/GO categories of the modules, and the phenotypic traits represented as nodes.

