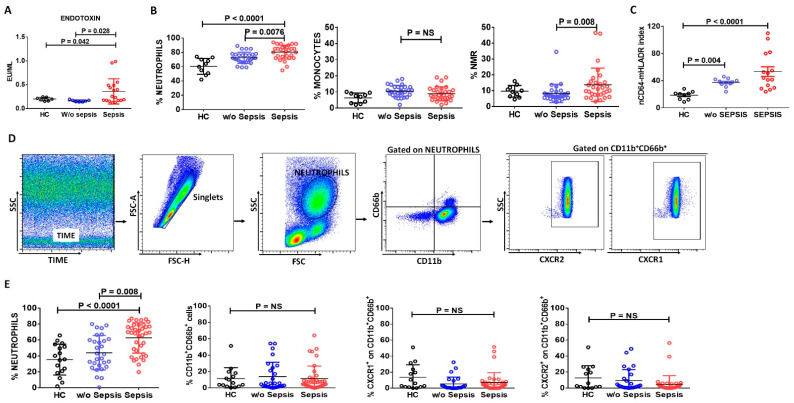
Figure 1.
Expression of neutrophils, monocytes, and nCD64-mHLADR Index in patient groups. Scatter dot plot shows (A) Endotoxin levels, (B) differential leukocyte count (DLC): neutrophils, monocytes, and neutrophils to monocyte ratio (NMR) by analyzing complete blood count and (C) nCD64-mHLADR Index between the groups. (D) Sequential gating strategy for identification of neutrophils and their activated markers, i.e., CXCR1, CXCR2 and CD66b using flow cytometry. (E) Scatter dot plot shows the percent of neutrophils, CD11b+CD66b+, percent of CXCR1+ and CXCR2+ on CD11b+CD66b+ between the groups using flow cytometry. Results are expressed as the mean ± SD; One-way ANOVA/Kruskal–wallis test followed by probability adjustment by the Mann–Whitney.

