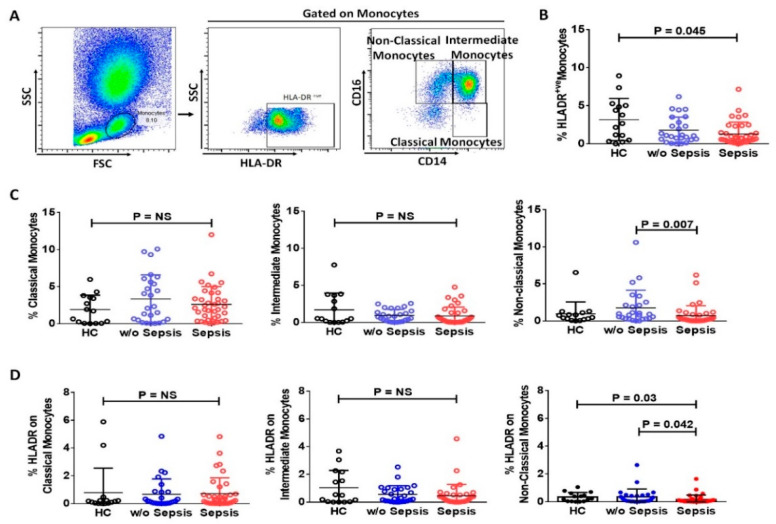
Figure 3.
Expression of monocytes and its sub-types in patient groups. (A) Sequential gating strategy for identification of monocytes and their sub-types using flow cytometry. Scatter dot plot shows the expression of (B) HLA-DR+ve on monocytes, (C) Sub-types i.e., classical, intermediate, and non-classical monocytes. (D) HLA-DR expression on classical, intermediate, and non-classical monocytes. Results are expressed as the mean ± SD; One-way ANOVA/Kruskal–wallis test followed by probability adjustment by the Mann–Whitney.

