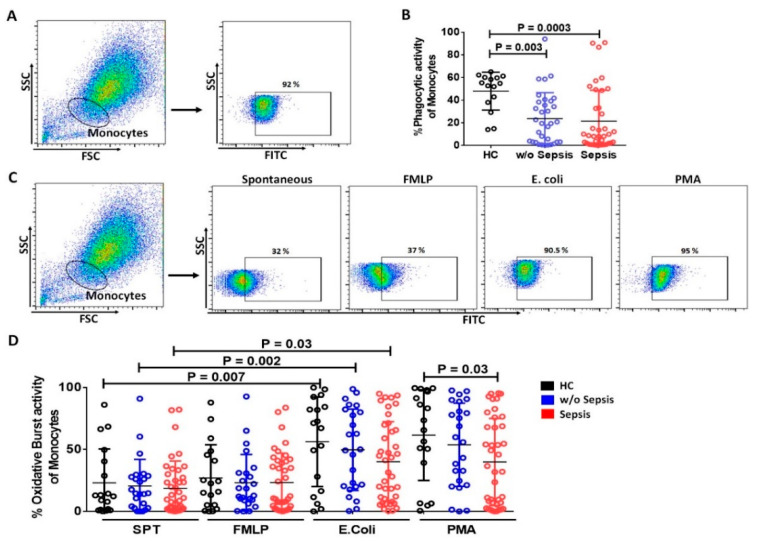
Figure 4.
Functionality of monocytes. (A) Gating strategy for phagocytic activity of Monocytes. (B) Scatter dot plot shows phagocytic activity of monocytes between the groups. (C) Gating strategy for oxidative burst activity of monocytes spontaneously and stimulation with FMLP, E. coli and PMA. (D) Scatter dot plot shows oxidative burst activity of monocytes between the groups. SPT (spontaneous). Results are expressed as the mean ± SD; One-way ANOVA/ Kruskal–wallis test followed by probability adjustment by the Mann–Whitney.

