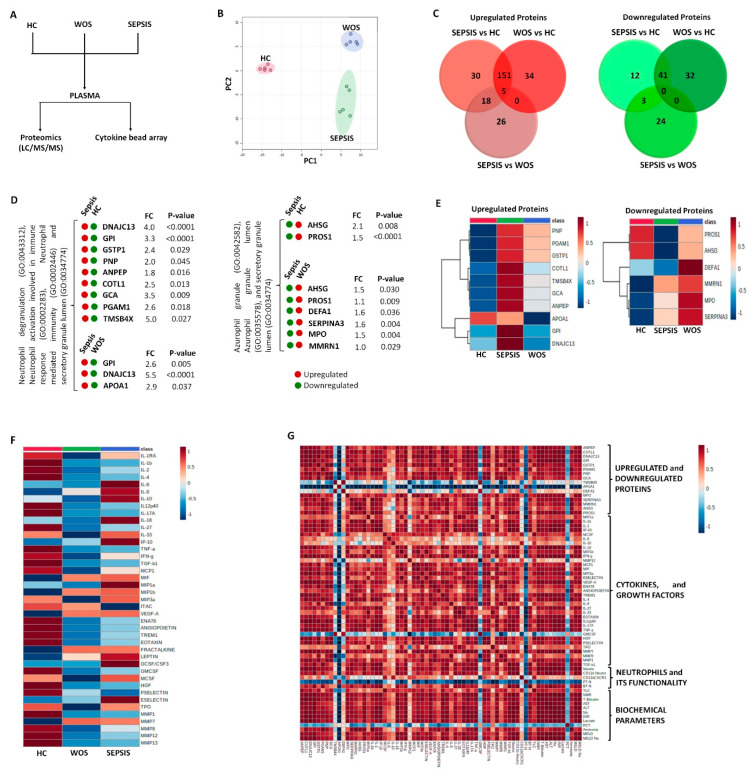
Figure 5.
Identification of proteins, and cytokines linked with neutrophils. (A) Schematic representation of the work pipeline followed for proteomics and cytokine bead array. (B) Principal component analysis (PCA) between the groups. (C) Venn diagram showing total upregulated and downregulated proteins between the groups. (D) Few upregulated and downregulated proteins related to neutrophil activity which were found significant between the groups. (E) Heatmap showing these upregulated and downregulated proteins between the groups. (F) Cytokine bead array analysis between the groups. (G) Correlation matrix among %neutrophils, proteins, cytokines, and biochemical parameters in sepsis patients. It was obtained by deriving a Pearson correlation coefficient. Red is a positive correlation, and blue is a negative correlation.

