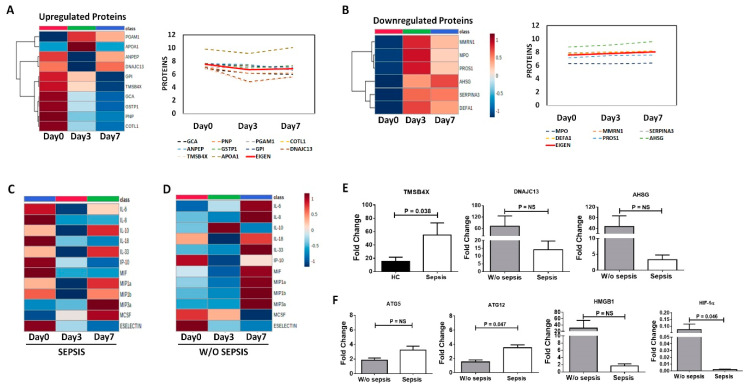
Figure 6.
Proteins and cytokines at different time points. Heatmap and Line diagram showing the expression of (A) Upregulated and (B) downregulated proteins in sepsis patients compared at Day 0, Day 3 and Day 7. The line diagram shows the log values of all the proteins (dotted line) and Eigen value of all the proteins (solid line). An eigen values are unit-less and are derived via PCA. Expression of cytokines, chemokines, and growth factors in (C) sepsis and (D) w/o sepsis at different time points i.e., Day 0, Day 3 and Day 7. Column bar graphs show fold change of (E) TMSB4X, DNAJC13, and AHSG, and (F) ATG5, ATG12, HMGB1 and HIF-1α using QRT-PCR.

