Figure 8.
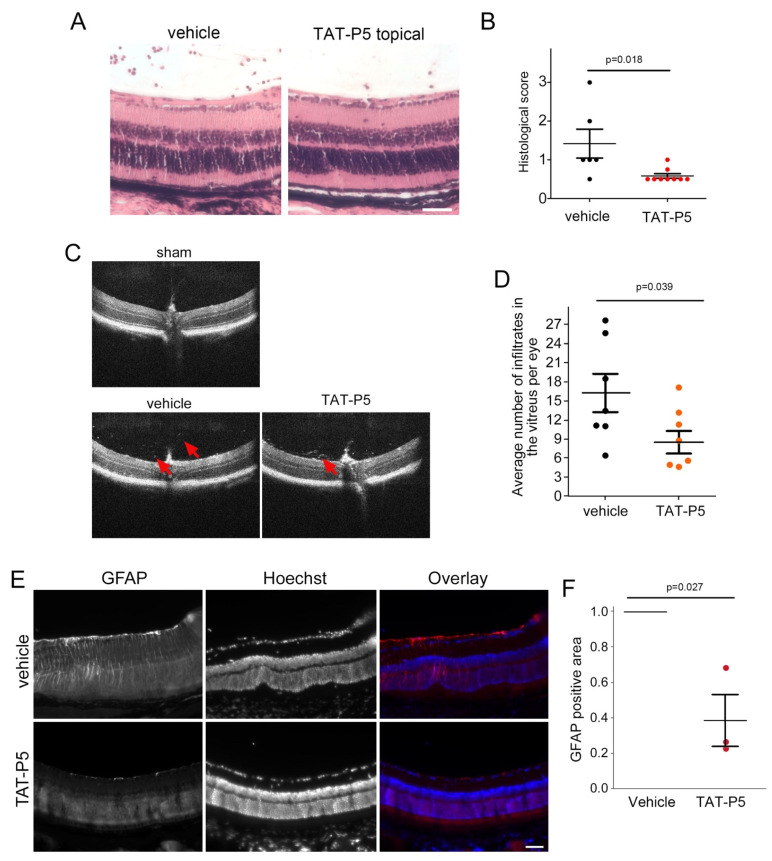
TAT-P5 reduces retinal damage in EAU. EAU was induced in mice and treated and analyzed as described in Figure 7A,B H&E-stained paraffin sections from vehicle control and TAT-P5 eyes were analyzed at day 29 (A). The eyes were histologically scored upon inspection of entire retinal sections (B, see also Figure S8A). (C,D) SD-OCT images obtained on day 28 after disease induction were quantified for vitreous infiltrates. 29 images of the central region around the optic nerve were quantified per eye and averaged to obtain a single value for each diseased eye. Arrows indicate infiltrates. (E,F) Retinal sections were stained for GFAP to label activated Müller glial cells. GFAP staining intensity was analyzed in sections derived from 3 eyes for each condition (see also Figure S8B). Vehicle-treated sections were set to 1 for each pair analyzed, which is indicated with a line that represents the three controls. Each data point represents one eye and statistical significance was assessed using two-sided (C,D) or one-sided single sample (F, comparing to a test mean of 1) tests. Scale bars indicate 50 µm.

