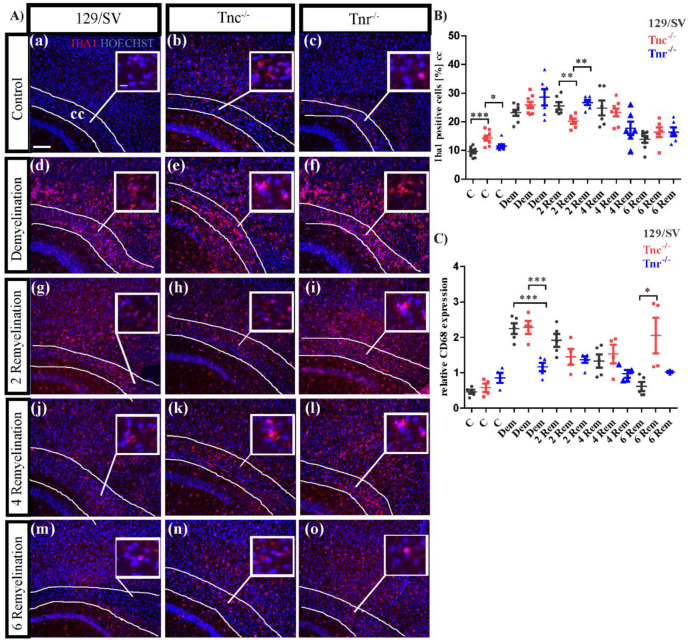
Figure 8.
Activation of microglia upon cuprizone treatment. (A(a–o)) Sagittal sections of cuprizone-treated mice were immunohistochemically stained with an antibody against Iba1 to detect microglia (red color). Hoechst was used as a marker for cell nuclei. Five different conditions were analyzed: control (C), demyelination (DM), 2-, 4- and 6 weeks of remyelination (RM2, RM4 and RM6). Images show the caudal part of the corpus callosum (CC) above the hippocampus (HC), circle triangle squares show a better visualization of the cells. Significantly more Iba1 positive cells were detected in Tnc−/− and Tnr−/− mice (A(a–c),B). During demyelination, the number of Iba1 positive cells was strongly increased in comparison to the control and in the absence of Tnr the number of microglia was significantly increased (A(d–f),B). After 2 weeks of remyelination the number of Iba1 positive cells was decreased in Tnc−/− mice (A(g–i),B). This effect contrasts with the results of the latest stage of remyelination after 6 weeks where the number of Iba1 positive cells was significantly increased in Tnc−/− mice (A(m–o),B). RT-PCR analysis of CD68 to monitor the expression pattern of activated microglia was carried out. In the absence of Tnr, more activated microglia were present in the control condition (A(a–c),C). In contrast, the CD68 expression during demyelination seemed reduced in Tnr−/− (A(d–f),C). In the absence of Tnr the expression of CD68 was limited and even during demyelination and the first two remyelination stages (2 and 4 weeks) the expression increased only minimally (A(g–o),C). After 6 weeks of remyelination, the highest CD68 expression was measured in Tnc−/−. Data are presented as mean ± SEM and statistical significance (p ≤ 0.05 *, p ≤ 0.01 **, p ≤ 0.001 ***) was assessed using the ANOVA and Tukey’s multiple comparison test for each group (control, demyelinated, remyelinated). Four independent experiments were performed (N = 4).

