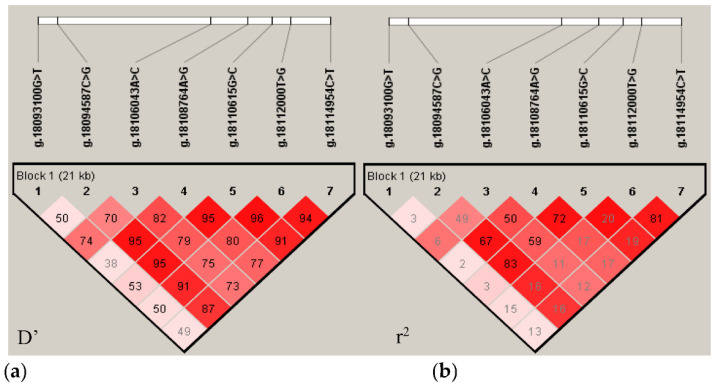
Figure 2.
Haplotype constructed by seven SNVs of the NR6A1 gene. Note: the linkage disequilibrium (LD) plot within 7 SNVs of the NR6A1 gene was computed by Haploview 4.2 software. The color of each square from light to dark (white to red) indicates the degree of LD from low to high. (a) the linkage disequilibrium index of D’, (b) the linkage disequilibrium index of r2.

