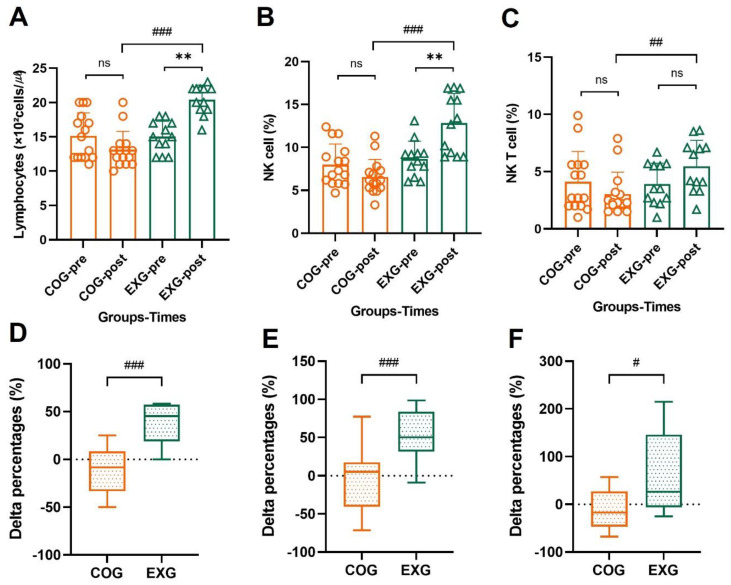
Figure 6.
NK and NKT cells of lymphocytes are improved in the ovarian cancer survivors after 12 weeks of aerobic and resistance exercise. (A) Lymphocyte’s absolute values in the control group (COG) and in the exercise group (EXG). (B) NK cell percentages of lymphocyte’s absolute values in the COG and EXG. (C) NKT cell percentages of lymphocyte’s absolute values in the COG and EXG. (D) Percentages of lymphocyte analyzed as Δ% in both groups. (E) Percentages of NK cells analyzed as Δ% in both groups. (F) Percentages of NKT cells analyzed as Δ% in both groups. All data are represented as means ± SD. p-values were calculated by Student’s t test or Mann–Whitney U test. For (A) to (F), these tests were performed independently at each time point; # p < 0.05, ## p < 0.01, and ### p < 0.001. p-values were calculated by Student’s t test or Wilcoxon signed rank test. For (A) to (C), these tests were performed dependently at each time point; ns: p > 0.05 and ** p < 0.01.

