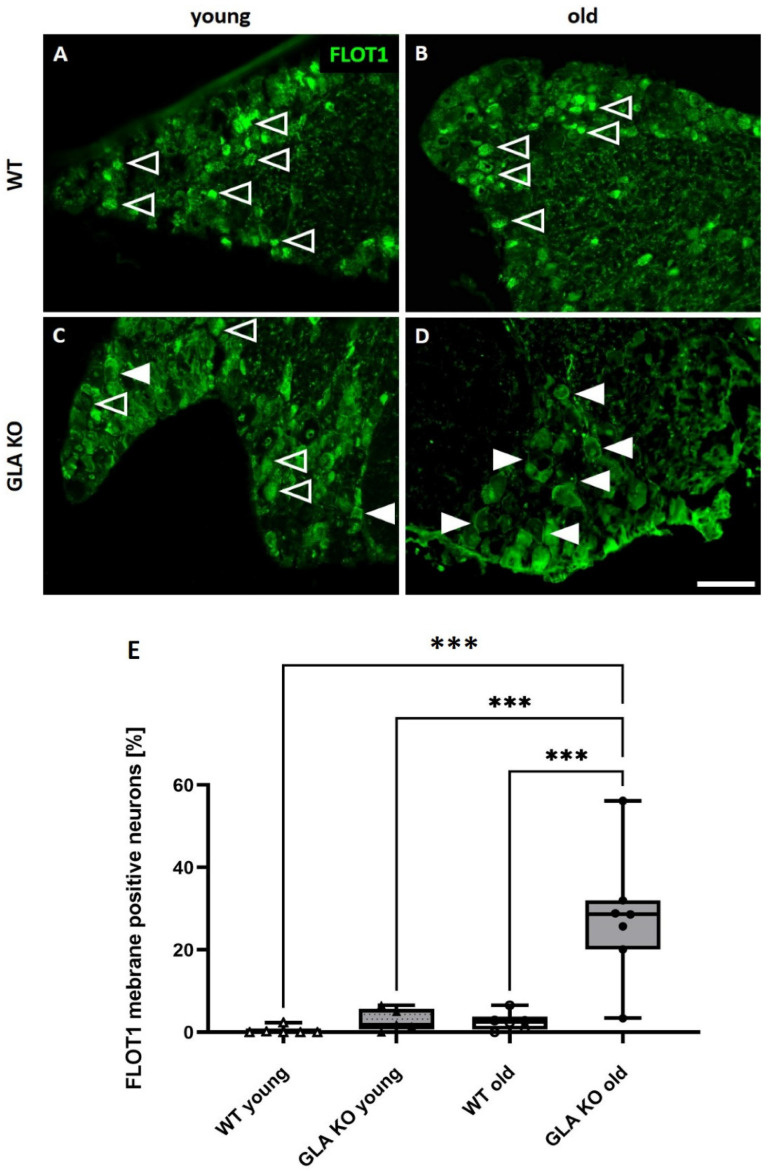
Figure 7.
FLOT1 distribution analysis in murine DRG neurons. (A–D) Representative photomicrographs of FLOT1 distribution in murine DRG neurons. (A) Granular cytosolic FLOT1 distribution in DRG neurons of young (A) and old (B) WT mice (empty arrowheads). Mixed FLOT1 distribution represented as granular cytosolic signal (empty arrowheads) and membranous signal (full arrowheads) in DRG neurons of young GLA KO (C). Predominantly membranous FLOT1 distribution in DRG neurons of old GLA KO mice (D). Quantification of FLOT1-positive DRG neurons of young WT (△, n = 6); young GLA KO (▲, n = 5), old WT (◯, n = 6), and old GLA KO (●, n = 7) mice displaying a membranous distribution pattern (E). Abbreviations: DRG = dorsal root ganglia; FLOT1 = flotillin-1; GLA KO = alpha-galactosidase A knockout; WT = wildtype. Scale bar: 100 µm. *** p < 0.001.

