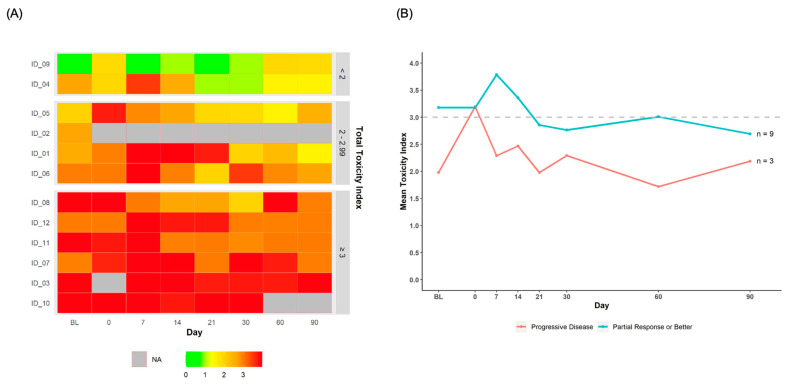
Figure 2.
(A) Heatmap of toxicity index scores for each participant across time, listed from lowest to highest average within-person Toxicity Index. Abbreviations: BL, baseline; NA, not applicable/data missing. (B) Average toxicity index scores over time by participants’ treatment response at day 90 (partial response or better vs. progressive disease). The dashed grey line represents a Toxicity Index score of 3.0 so that scores can be easily identified as mild to moderate (<3.0) vs. severe (≥3.0). Abbreviations: BL, baseline.

