Figure 2.

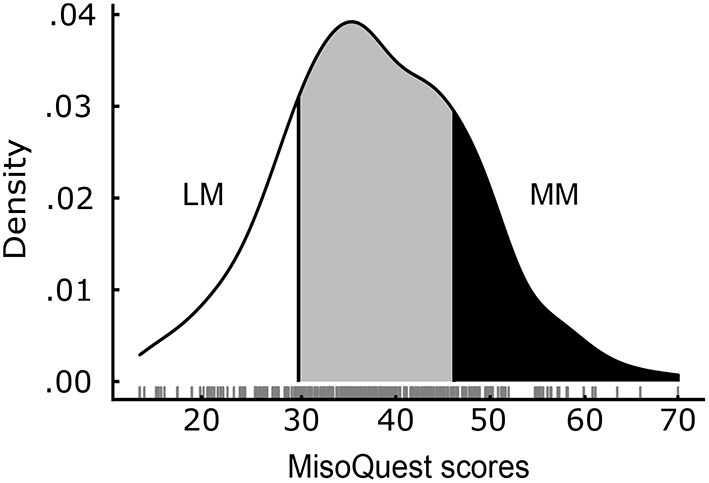
Distribution of MisoQuest scores (N = 300). Least-Misophonic (LM) and Most-Misophonic (MM) groups represent the top and bottom 20% of the distribution. Actual scores are plotted below the curve (jittered for better visualization).

Distribution of MisoQuest scores (N = 300). Least-Misophonic (LM) and Most-Misophonic (MM) groups represent the top and bottom 20% of the distribution. Actual scores are plotted below the curve (jittered for better visualization).