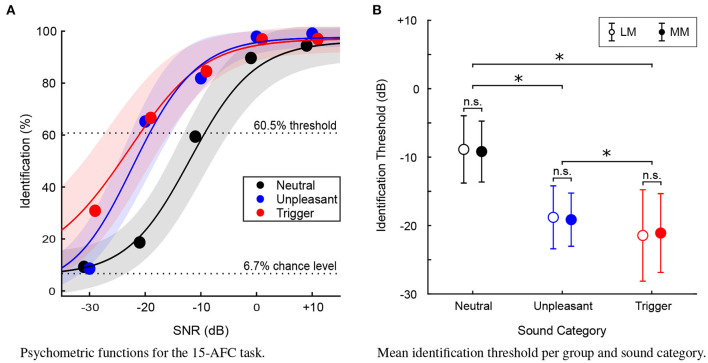
Figure 3.
(A) Psychometric functions (N = 300) for the 15-AFC identification task. Average percent identification plotted at each (SNR) level, for each sound category. Solid lines represent the mean of the fits and shaded areas represent ±1 standard deviation. Dotted lines represent chance level and the performance level chosen to define identification thresholds of the 15-AFC task. (B) Mean identification threshold for each sound category, for the Least-Misophonic (LM) and Most-Misophonic (MM) groups. Error bars represent ±1 standard deviation. Asterisk (*) indicates a statistically significant difference (p < 0.01), “n.s.” indicates a non-significant difference.

