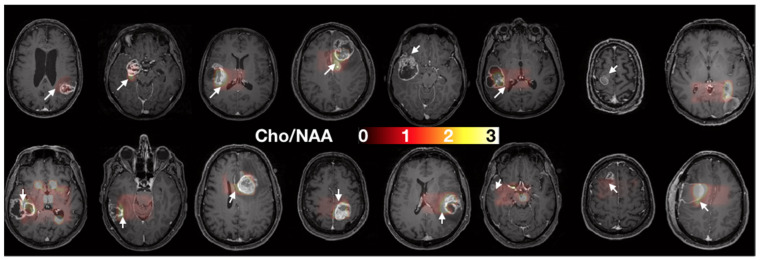
Figure 2.
Axial slices of each patient prior to surgery. Spectroscopy (Cho/NAA) maps overlying T1 contrast-enhanced images were used to determine the two sites of sample collection (i.e., one target in the CNI > 2 region, white arrows, and one target control in the CNI < 2 regions. When no CNI > 2 was present, the maximal CNI value was used for the target.

