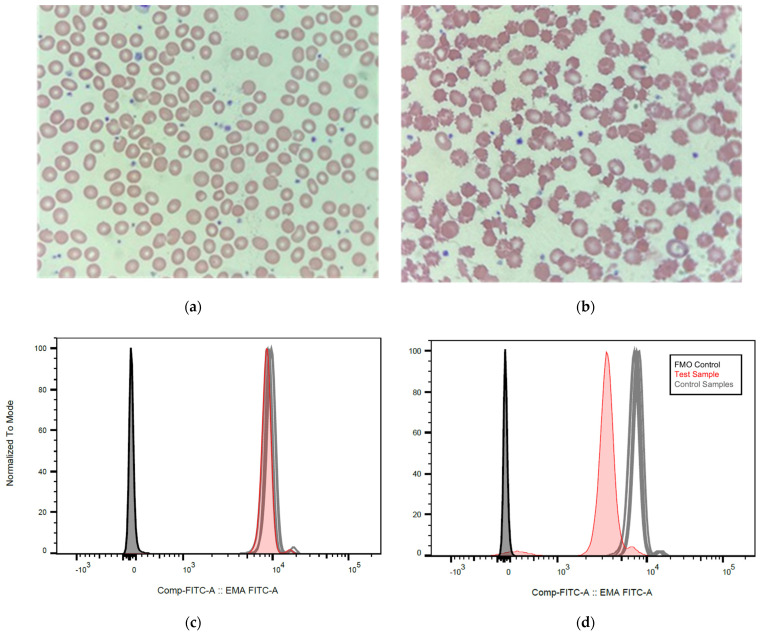
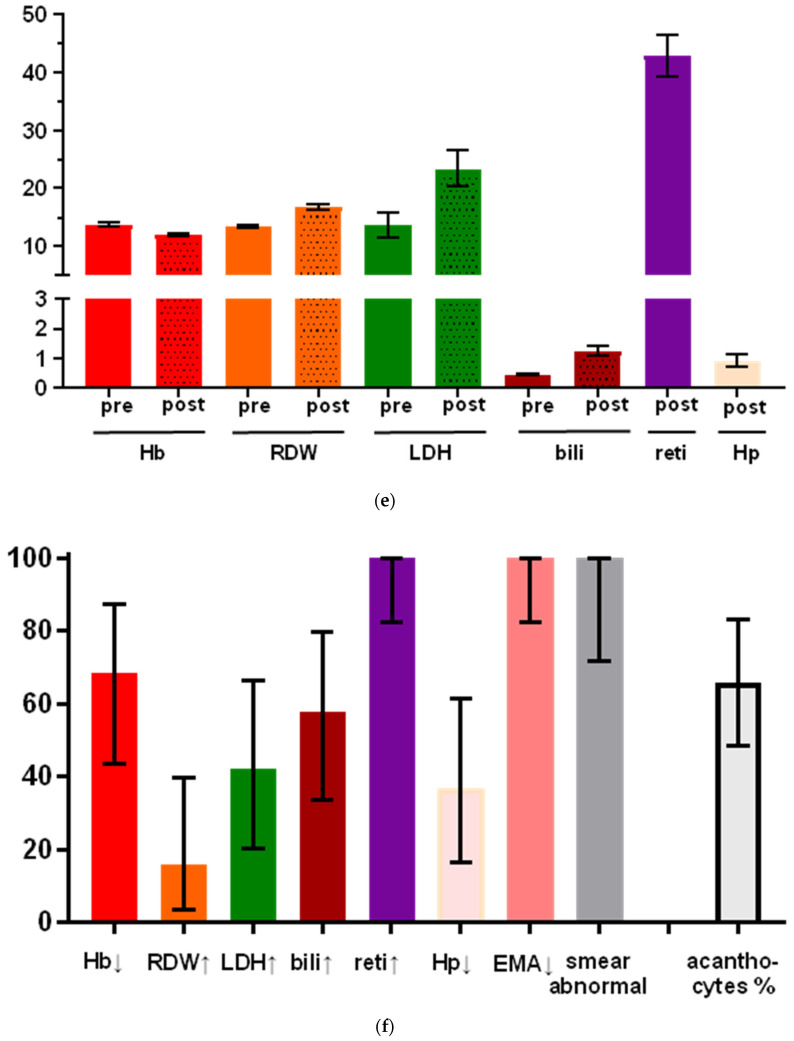
Figure 1.
Development of peripheral blood changes after the start of alectinib in ALK+ NSCLC. (a) Peripheral blood film of patient 8 (Table 1) at 67× magnification showing normal red cell morphology before alectinib start. (b) Peripheral blood film two weeks after alectinib start at 67× magnification showing abnormal red cell morphology with anisocytosis, a predominance of acanthocytes, as well as occasional echinocytes, spherocytes, and rare fragmentocytes (Table 1). (c) EMA binding assay of the same patient before therapy with alectinib showing a 10% decrease in EMA fluorescence (reference range <20%). (d) In the same patient, six weeks after alectinib start, EMA fluorescence is reduced by 58%. (e) Changes in hemoglobin (Hb, in g/dL, n = 16), red-cell distribution width (RDW, %, n = 17), serum lactate dehydrogenase (LDH, in U/mL/10, n = 16), total serum bilirubin (bili, in mg/dL, n = 11), blood reticulocytes (reti, %, n = 18), as well as levels of serum haptoglobin (Hp, in g/L, n = 19) and after start of alectinib in our patients. Statistical comparisons were performed with a paired t-test for parameters with available data before and after alectinib start (Hb, RDW, LDH, bilirubin) or using a t-test comparison vs. the upper or lower limit of the normal range for other parameters (5–15% for reticulocytes, and 0.3–2.0 g/L for haptoglobin). Box plots indicate mean values with their standard errors (from left to right: 13.8 g/dL vs. 12.0 g/dL, 13.4% vs. 16.8%, 136 U/L vs.234 U/L, 0.45 mg/dL vs.1.26 mg/dL, 43% with p < 0.0001 compared to the normal range, 0.93 g/L within the normal range of 0.3–2.0 g/L); ns: not statistically significant. (f) The percentage of patients with abnormal values for each of the parameters analyzed in this study, according to Table 1. Bars indicate percentages with 95% confidence intervals: 68.4% [43.5–87.4] for reduced serum hemoglobin, 15.8% [3.4–39.6] for increased RDW, 42.1% [20.2–66.5] for increased serum LDH, 57.9% [33.5–79.8] for increased serum bilirubin, 100% [82.4–100] for increased blood reticulocytes, 36.8% [16.3–61.6] for reduced serum haptoglobin, 100% [82.4–100] for reduced EMA binding, and 100% [71.5–100] for the presence of abnormalities in the blood smear, while the mean percentage of acanthocytes in the peripheral blood smear was 65.8% [48.6–83.1].


