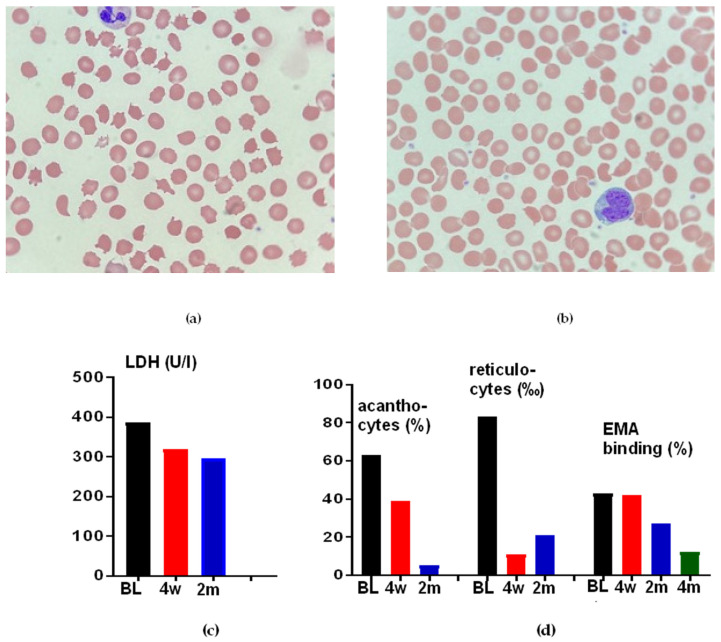
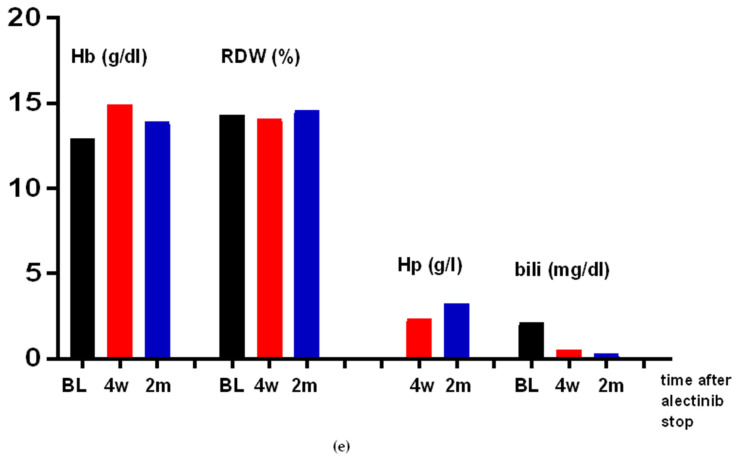
Figure 2.
Resolution of erythrocyte changes after alectinib stop in patient 1 (Table 1). (a) Peripheral blood film at 100× magnification showing abnormal red cell morphology during therapy with alectinib. (b) Blood smear 4 weeks after the switching of therapy to brigatinib at 100× magnification with the return of some normal erythrocytes. (c–e) Longitudinal resolution or improvement of other changes in the same patient after alectinib stop; BL: baseline; 4 w: 4 weeks after treatment stop; 2 m: 2 months after treatment stop.


