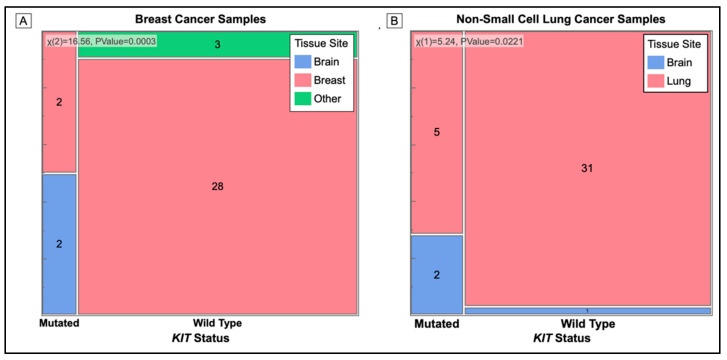
Figure 5.
Mosaic Plot of Cancer Tissue Biopsy Site (Primary and Metastatic) used for Mutation Analysis. Cell sizes are proportional to the number of samples in that category. Mutation status is on the X-axis and color represents the tissue sample of origin. (A) All KIT mutations occur in biopsy samples of breast cancer taken from the brain. The p-value = 0.0003. (B) Biopsy samples taken from the brain have a higher number of KIT mutations than samples from the lung. The p-value = 0.0221.

