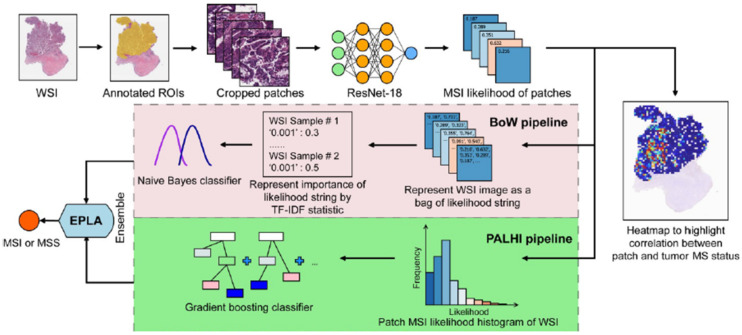
Figure 5.
Example of an artificial intelligence model for colorectal cancer. Figure 1. Overview of the Ensemble Patch Likelihood Aggregation (EPLA) model. A whole slide image (WSI) of each patient was obtained and annotated to highlight the regions of carcinoma (ROIs). Next, patches were tiled from ROIs, and the MSI likelihood of each patch was predicted by ResNet-18, during which a heat map was shown to visualize the patch-level prediction. Then, patch likelihood histogram (PALHI) pipelines and bags of words (BoW) pipelines integrated the multiple patch-level MSI likelihoods into a WSI-level MSI prediction, respectively. Finally, ensemble learning combined the results of the two pipelines and made the final prediction of the MS status. Reprinted from Ref. [50].

