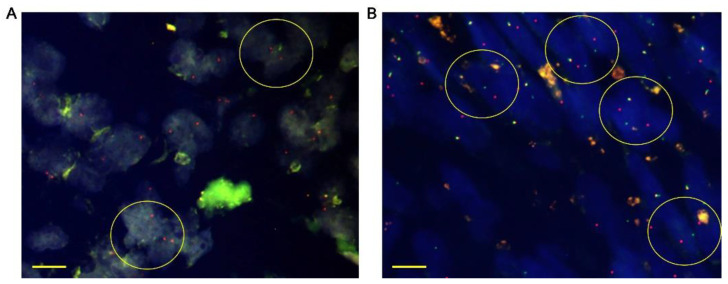
Figure 2.
Representative images of NTRK fusion detected by FISH. Tumor tissues were stained with dual-color FISH probes. The red and green signals represent upstream and downstream probes, respectively. FISH results showing (A) NTRK1 and (B) NTRK3 fusions. Each scale bar is 10 μM. Circles indicate gene rearrangements. NTRK: neurotrophic tyrosine receptor kinase; FISH: fluorescence in situ hybridization.

