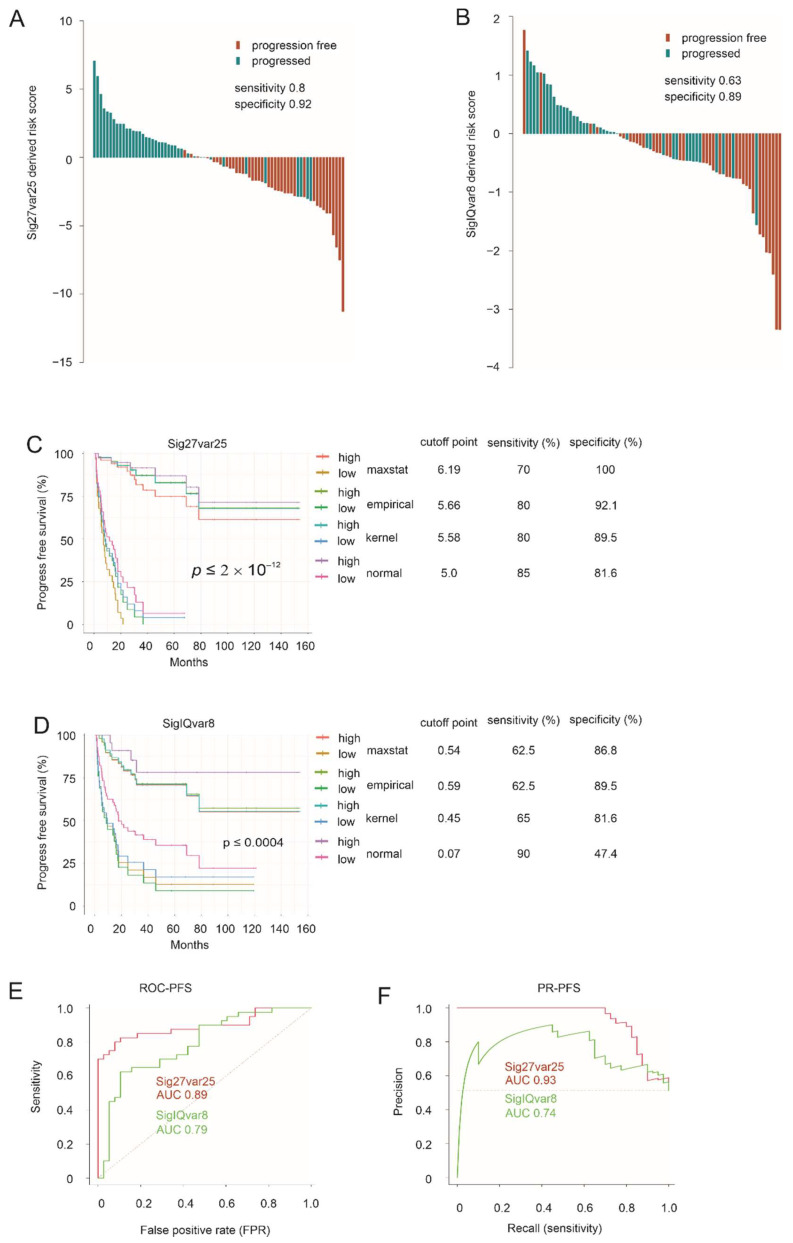
Figure 2.
Estimation of ACC progression by Sig27var25 and SigIQvar8. (A,B) Waterfall plots for Sig27var25 (A) and SigIQvar8 in stratification of ACC progression risk. The progression status, sensitivity, and specificity of the risk separation are indicated. Cutoff points were estimated using the empirical methods with n = 1000 bootstraps and used as the baselines for waterfall plot generation using R. (C,D) Separation of ACCs with a high risk of progression from those with low risk by the indicated signatures. Methods used in cutpoint estimation, cutpoints and the respective sensitivity and specificity are indicated. (E,F) ROC and PR curves for the indicated multigene panels.

