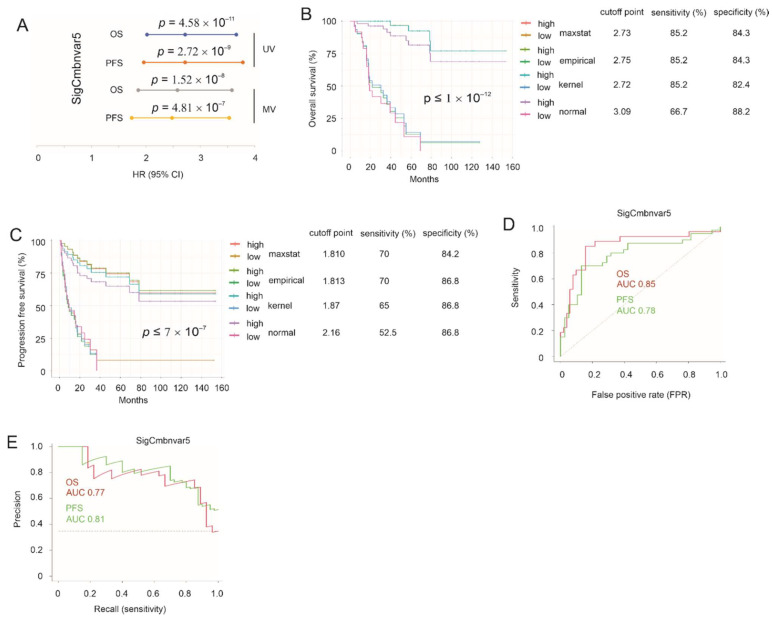
Figure 4.
Estimation of ACC progression and fatality risks by SigCmbnvar5. (A) HR, 95% CI, and the respective p-values for SigCmbnvar5-derived prediction of OS and PFS under both univariate (UV) and multivariate (MV) settings. MV includes age at diagnosis and tumor stages. (B,C) Stratification of ACCs fatality (B) and progression risk (C) with the indicated cutoff points. (D,E) ROC (D) and PR curves (E) for discrimination of OS and PFS.

