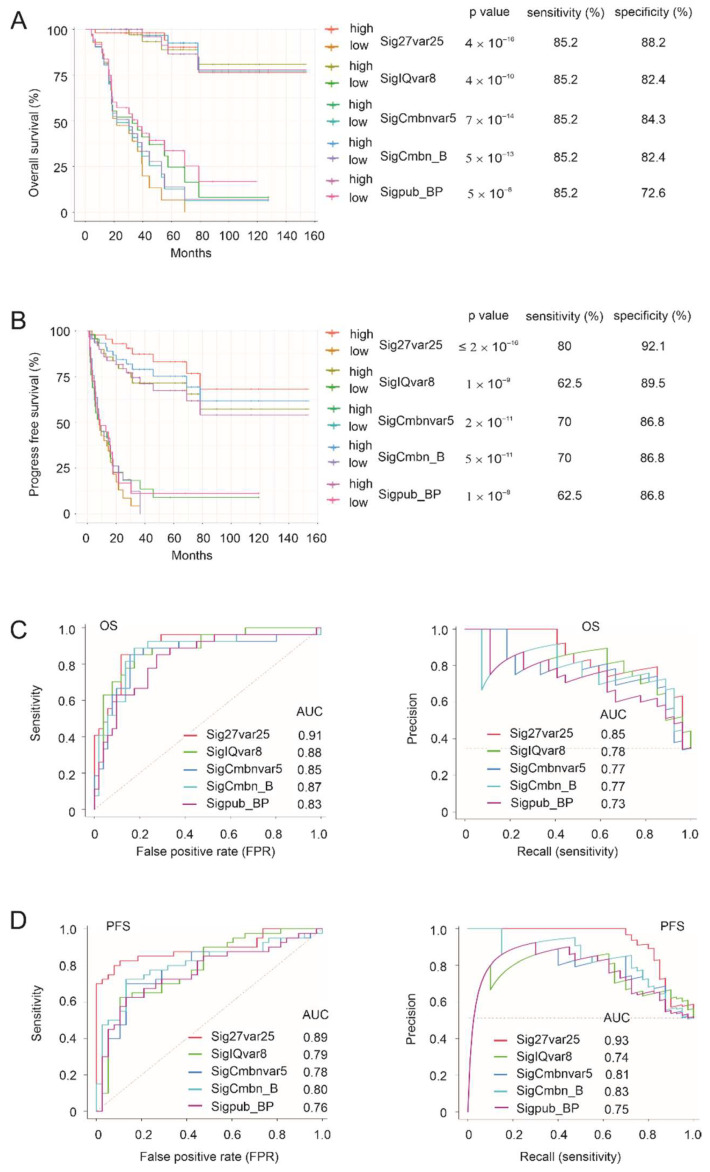
Figure 5.
Comparison of progression and fatality risk stratification among Sig27var25, SigIQvar8, SigCmbnvar5, SigCmbn_B, and Sigpub_BP. (A,B) Cutoff points for the indicated signature scores were estimated by the empirical method. The individual survival curves, p-values, sensitivities, and specificities for OS and PFS are shown. (C,D) OS ROC and PR curves (C) and PFS ROC and PR curves (D) for the indicated signatures.

