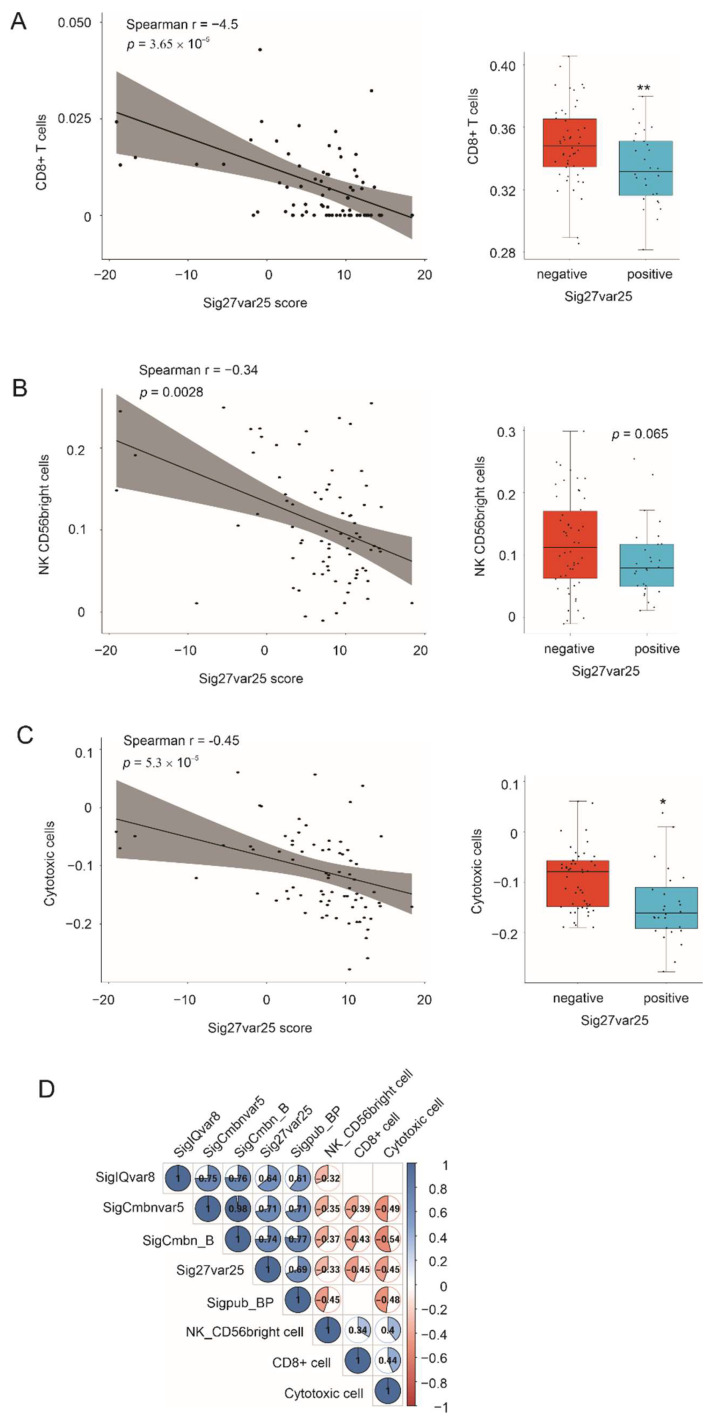
Figure 9.
Correlations of multigene signatures with reductions of CD8+ and NK cells in ACC. (A) Immune cells were profiled using Xcell within the MSDIC R package, followed by the determination of the correlation of CD8+ T cells with Sig27var25 scores using the ggpubr R package (left panel). The Sig27var25 negative and positive ACC (boxplot, right panel) were defined with the cutoff point estimated using an empirical method (right panel). (B,C) NK CD56bright and cytotoxic cells in ACCs were profiled using ssGSEA within the MSDIC R package. (D) Scores from the indicated multigene signatures, NK CD56bright cells, CD8+ T cells, and cytotoxic cells were used to construct the Spearman correlation image with the corrplot R package. Correlations with p < 0.01 are included. * p < 0.05; ** p < 0.01.

