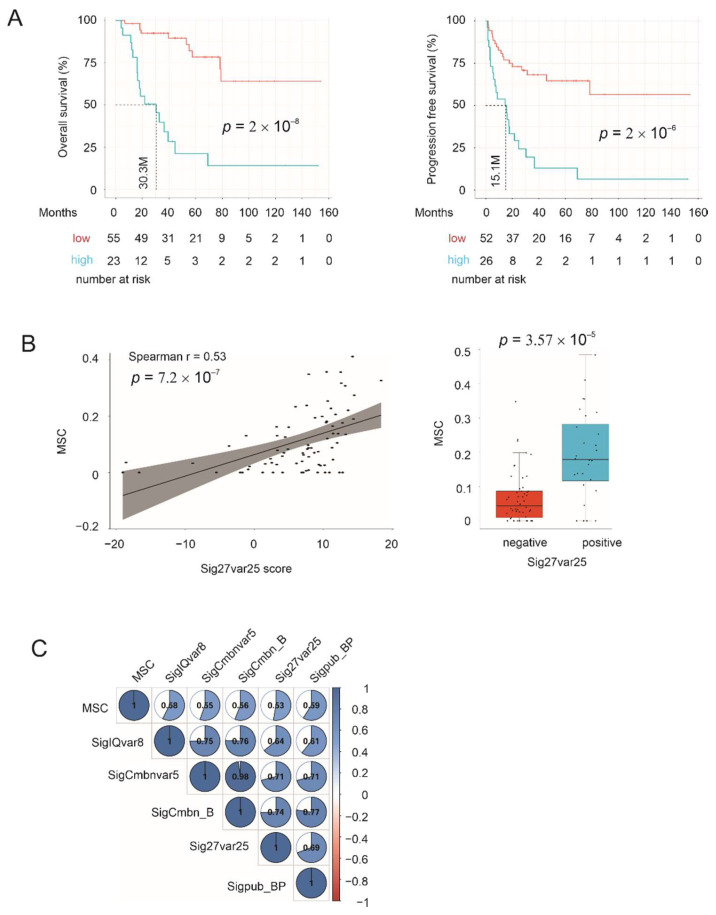
Figure 10.
Correlation of multigene signatures with MSC. (A) MSCs in ACC were profiled using xCell within the MSDIC R package. Cutoff points for OS and PFS were estimated using Maximally Selected Rank Statistics, which were used to construct the survival curves. (B) Correlation of MSC with Sig27var25 score (left panel) and enrichment of MSCs in Sig25var25 positive ACCs (right panel). The positive and negative statuses were defined according to the empirically derived cutoff point. (C) Correlations of MSC with the indicated signatures were determined by Spearman correlation; all correlations are at p < 0.01.

