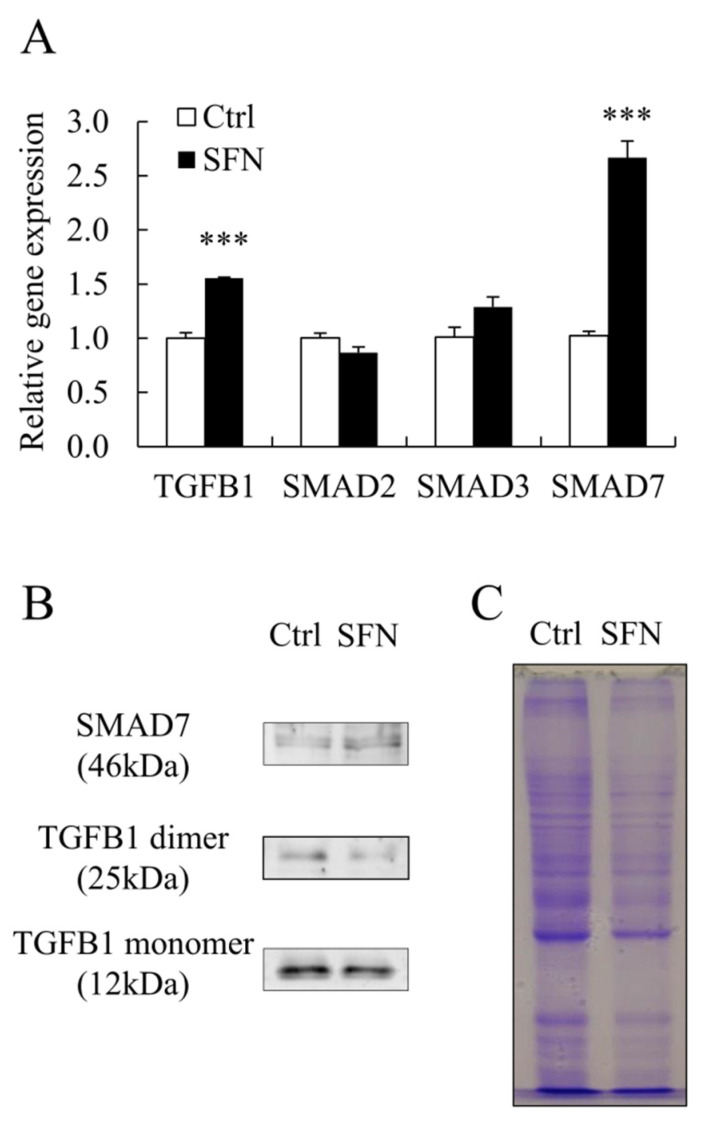
Figure 4.
The expression of SMAD7 was upregulated by SFN treatment. (A): Relative mRNA expression levels of TGFB1, SMAD2, SMAD3, and SMAD7; (B,C): The protein levels of TGFB1 and SMAD7 with Coomassie-Brilliant Blue staining as loading control. Data are shown as the mean ± SE and assays were done in triplicates. *** p < 0.001.

