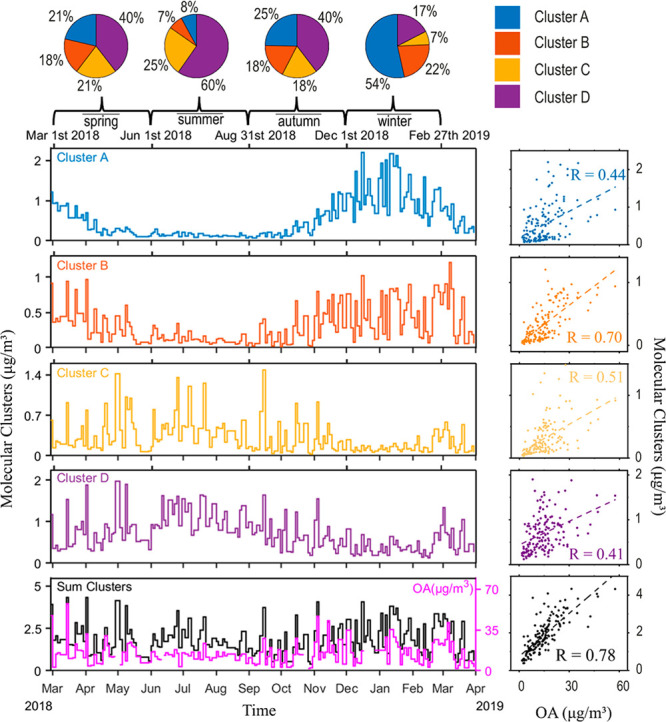
Figure 4.

Concentration time series of compounds in clusters A, B, C, D, sum of the four clusters, and OA (data from ACSM). The scatter plots show the correlation between the four individual cluster and OA, as well as the correlation between the sum of the four clusters and the OA content. The pie charts display the concentration fractions of individual cluster in sum of the four clusters in spring, summer, autumn, and winter.
