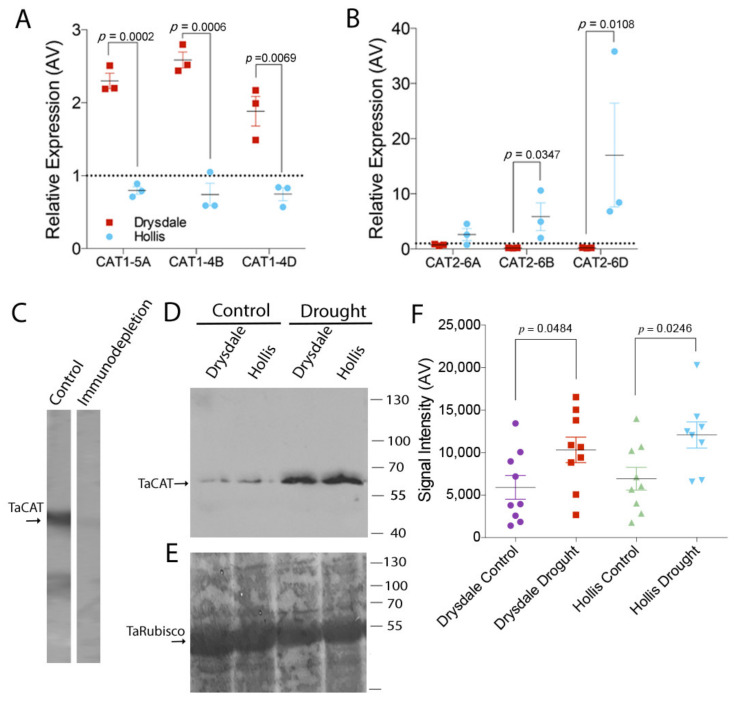
Figure 7.
Characterization of Catalase in response to drought stress. (A) Transcription of CAT1 homoeologs in leaves of control and drought-stressed Hollis and Drysdale plants. p-values were calculated using Student t-test (n = 3). (B) Transcription of CAT2 homoeologs in leaves of control and drought-stressed Hollis and Drysdale plants. p-values were calculated using Student t-test (n = 3). Values above the dashed line indicate up-regulation; values below the line indicate down-regulation. (C) Western blotting with anti-CAT or following immunodepletion of the antibody with the CAT protein. Pre-incubation of the antibody with catalase abrogates recognition of catalase on the membrane with total protein extract from the leaf of Drysdale plants. (D) Western blotting of total protein extracts from leaves of control and drought-stressed Drysdale and Hollis plants. Bars and numbers indicate the position and corresponding size of molecular weight markers. (E) Colloidal silver staining of the Western blotting membrane showing total protein in the corresponding extracts. Bars and numbers indicate the position and corresponding size of molecular weight markers. (F) Quantification of CAT protein levels on the Western blotting membranes. p-values represent Student t-test results of three technical replicates of extracts from three biological replicates (individual plants).

