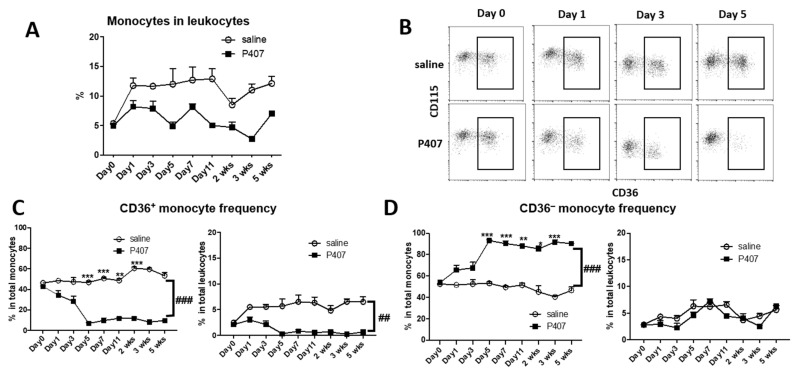
Figure 4.
Changes in the proportions of monocytes and subsets in Ldlr−/− mice with P407 injection. (A) Changes in percentages of total monocytes in total leukocytes in Ldlr−/− mice with injection of P407 or saline control. (B) FACS examples showing rapid and profound reductions in CD36+, but not CD36–, monocytes in Ldlr−/− mice with P407 injection. Changes in percentages of (C) CD36+ and (D) CD36− monocytes in total monocytes or in total leukocytes in Ldlr−/− mice with injection of P407 or the saline control. n = 7 mice/group. Data are shown as mean ± SEM and were analyzed by two-way ANOVA with repeated measures and assumption of inequivalence of variance, followed by Šídák’s multiple pairwise comparisons test. * p < 0.05, ** p < 0.01, and *** p < 0.001 for comparisons between P407 and control groups. ## p = 0.01 and ### p < 0.001 for group x time interaction by two-way ANOVA.

