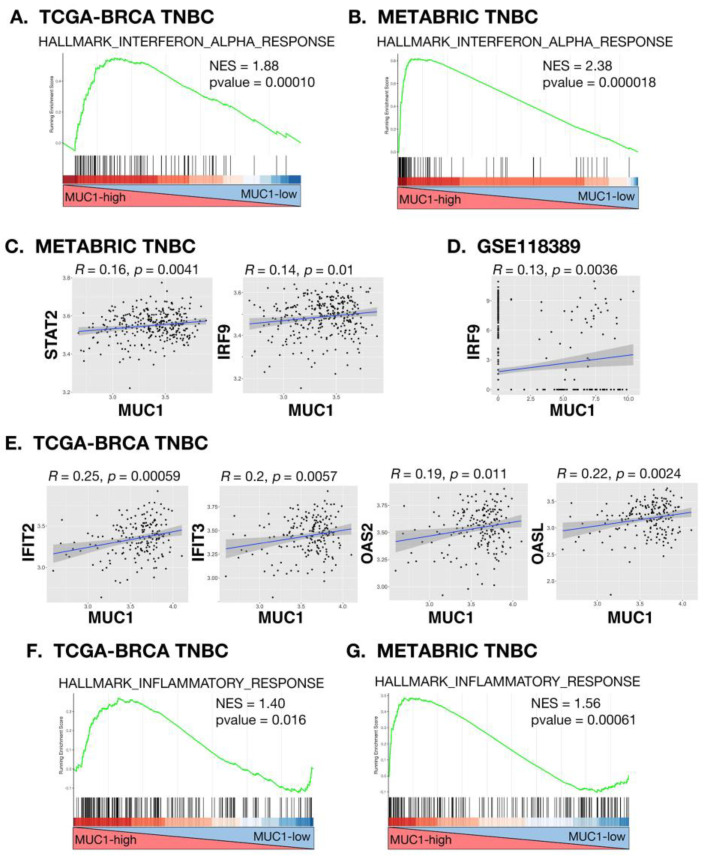
Figure 1.
MUC1-high TNBC tumors associate with type I IFN and inflammatory signaling pathways. (A,B) Enrichment plots for the HALLMARK INTERFERON ALPHA RESPONSE pathway, comparing MUC1-high to MUC1-low TNBC tumors in the TCGA-BRCA (A) and METABRIC (B) cohorts. (C) Scatter plots showing correlations of MUC1 with STAT2 and IRF9 in TNBCs from the METABRIC cohort. (D) Scatter plot of the correlation between MUC1 and IRF9 in single TNBC cells as analyzed from the GSE118389 scRNA-seq dataset. (E) Scatter plots showing correlations of MUC1 with IFIT2, IFIT3, OAS2 and OASL in TNBCs from the TCGA-BRCA and METABRIC TNBC cohorts. (F,G) Enrichment plots for the HALLMARK INFLAMMATORY RESPONSE pathway, comparing MUC1-high to MUC1-low TNBC tumors in the TCGA-BRCA (F) and METABRIC (G) cohorts.

