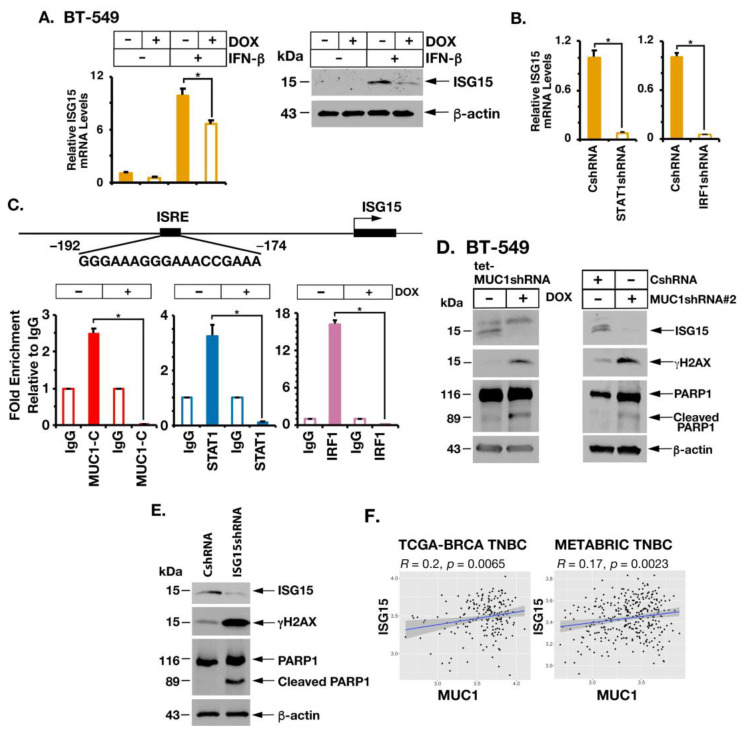
Figure 6.
Silencing MUC1-C downregulates ISG15 expression and induces the DNA damage response. (A) BT-549/tet-MUC1shRNA cells treated with vehicle or DOX for 7 days and stimulated with IFN-β for 24 h were analyzed for ISG15 mRNA levels by qRT-PCR (left). The results (mean ± SD of 4 determinations) are expressed as relative mRNA levels compared to that obtained for vehicle-treated cells (assigned a value of 1). Lysates were immunoblotted with antibodies against the indicated proteins (right). (B) BT-549 cells expressing a CshRNA, STAT1shRNA or IRF1shRNA were analyzed for ISG15 mRNA levels by qRT-PCR. The results (mean ± SD of 4 determinations) are expressed as relative mRNA levels compared to that obtained for vehicle-treated cells (assigned a value of 1). (C) Schema of the ISG15 promoter region with highlighting of the ISRE. Soluble chromatin from BT-549/tet-MUC1shRNA cells treated with vehicle or DOX for 7 days was precipitated with a control IgG, anti-MUC1-C, anti-STAT1 and anti-IRF1. The DNA samples were amplified by qPCR with primers for the ISG15 promoter region. The results (mean ± SD of 3 determinations) are expressed as fold enrichment relative to that obtained with the IgG control (assigned a value of 1). (D) Lysates from (i) BT-549/tet-MUC1shRNA cells treated with vehicle or DOX for 7 days (left) and (ii) BT-549/CshRNA and BT-549/MUC1shRNA#2 (right) were immunoblotted with antibodies against the indicated proteins. (E) Lysates from BT-549 cells expressing a CshRNA or ISG15shRNA were immunoblotted with antibodies against the indicated proteins. (F) Scatter plots showing correlations of MUC1 with ISG15 in TNBCs from the TCGA-BRCA (left) and METABRIC (right) cohorts. The asterisk (*) denotes a p-value < 0.05. Uncropped Western Blots can be found at supplemental original images.

