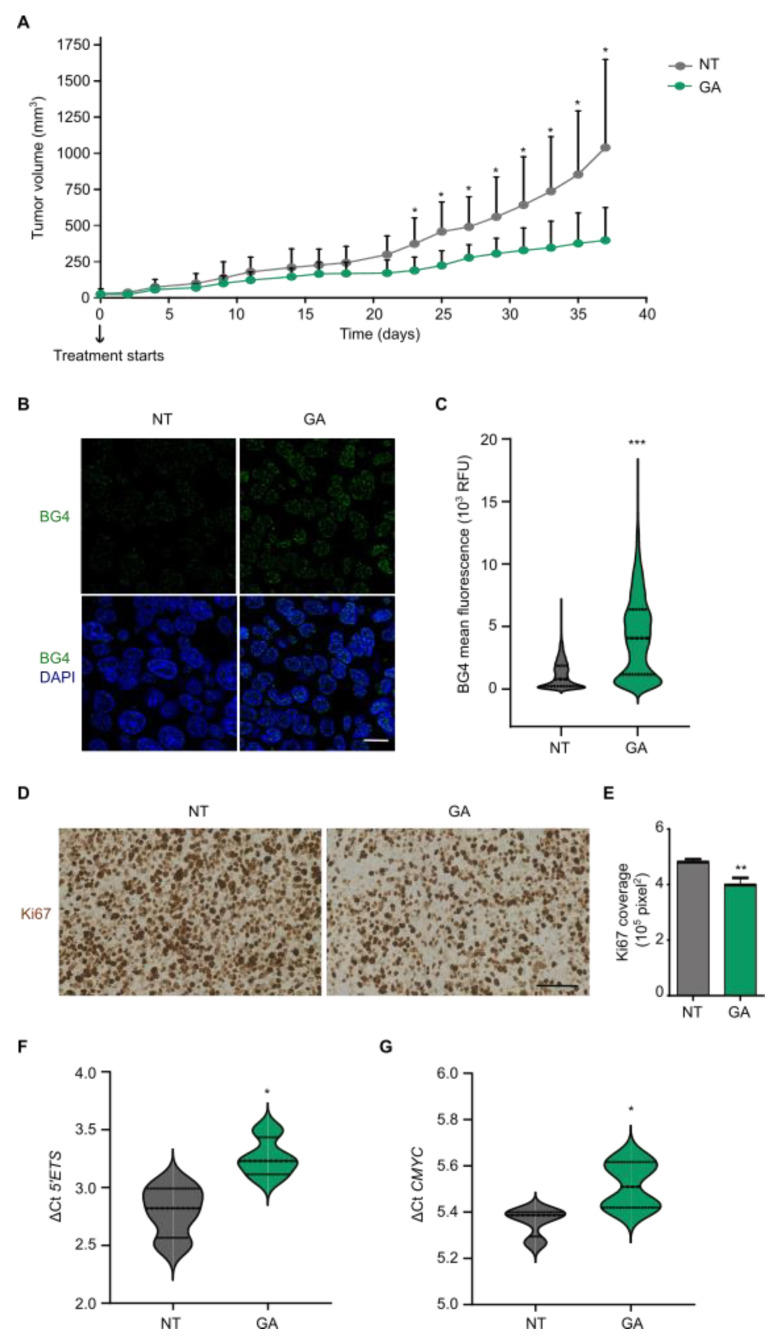
Figure 4.
Gallic acid blocks tumor progression and binds to G4s in vivo. (A) Tumor volume of SW480 xenograft mice treated with DMSO vehicle control (N = 5) or 200 mg/kg GA (N = 7) every other day for 38 days. Each point represents the mean tumor volume of the group ± standard deviation (only the positive bars are shown). (B) Representative images of BG4 immunofluorescence in tumor sections from control and GA-treated xenografts. Merged images with DAPI for DNA counterstaining are also shown. Scale bar, 10 µm. (C) Quantification of nuclear BG4 mean fluorescence intensity by Fiji analysis from tumor sections in (B) (N > 2000). (D) Representative images of Ki67 staining in tumor sections from control and GA-treated mice. Hematoxylin and eosin were used as counterstaining. Scale bar, 100 µm. (E) Quantification of Ki67 coverage from tumor sections in (D) by Fiji analysis (ten different images per tumor). (F) ΔCt results for 5′ETS expression obtained by qRT-PCR from control and responder mice. (G) ΔCt results for CMYC expression obtained by qRT-PCR from control and responder mice. For all tests, p-values below 0.05 were considered significant and expressed as follows: * p < 0.05; ** p < 0.01 and *** p < 0.001.

