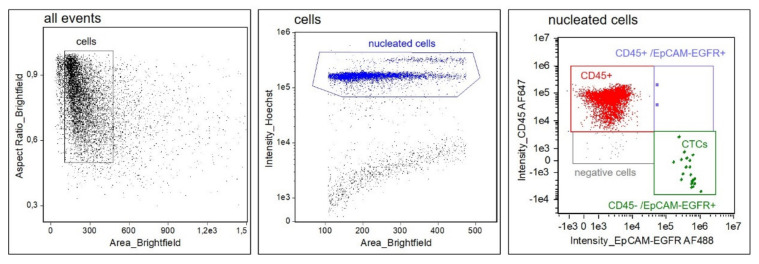
Figure 1.
Gating strategy for CTC detection. At first, speedbeads and debris are excluded. Hoechst staining intensity of the gated events is displayed in a 2D plot. Hoechstpositive nucleated cells (blue) are then separated by their fluorescence intensities for EpCAM–EGFR–AF488 and CD45–AF647. CTCs are defined as Hoechstpositive/CD45negative/EpCAM–EGFRpositive. Single CTCs are detected in the CD45negative/EpCAM–EGFRpositive gate (green), whereas cluster of leukocytes and CTCs are detected in the CD45positive/EpCAM–EGFRpositive gate (purple).

