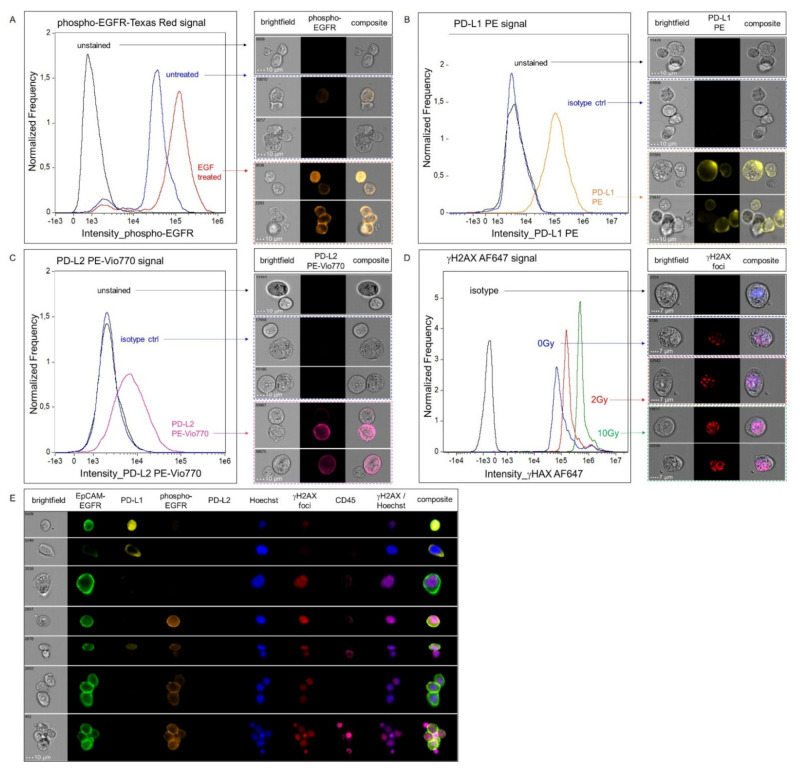
Figure 3.
Immunofluorescence analysis of phospho–EGFR, PD–L1/PD–L2 and γH2AX and multiparametric phenotyping. (A) Representative results of phospho–EGFR staining in UM–SCC–22B cells are shown. The histogram displays the fluorescence intensities in unstained (black), untreated (blue) and EGF–treated (red) cells. (B,C) Positive and negative cells for surface staining of PD–L1 (B) and PD–L2 (C) on MDA–MB–231 and SCC–25 cells, respectively, are shown. Fluorescence intensities for unstained (black), isotype control (blue) or samples stained with either anti–PD–L1 (orange) or anti–PD–L2 antibody (pink) are depicted. Clusters of cells were selected to demonstrate the heterogeneity of each cell line and the feasibility of the ISX to detect different expression intensities with high sensitivity. (D) γH2AX staining was performed in FaDu cells, untreated (blue) or irradiated with 2 Gy (red) or 10 Gy (green). Isotype control is shown in black. Representative images for the different conditions (acquired with the 60× objective at low speed) are presented at the right column of the figure. (E) Multiparametric phenotyping of spiked EGF–treated and irradiated FaDu cells in peripheral blood (acquired with 40× magnification).

