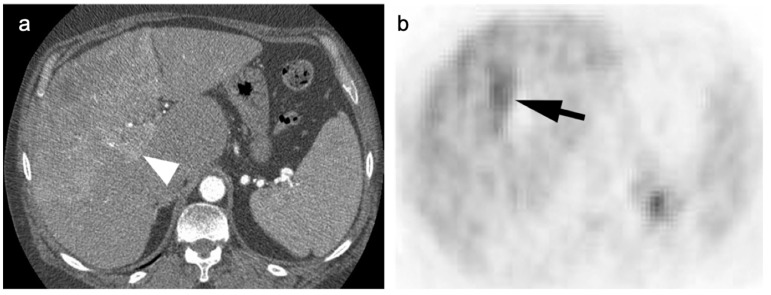
Figure 15.
(a) A biopsy-proven well-differentiated HCC shows diffuse arterial enhancement on contrast-enhanced CT (white arrowhead); (b) On axial FDG PET, this mass is largely isometabolic to the liver, although a central more focally hypermetabolic regions may indicate a region of more poorly differentiated tumor (black arrow).

